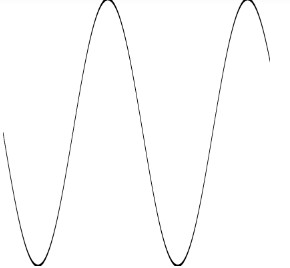
However, if you try it you will just see a small splodge at the top of the canvas. The reason is, of course that the x value varies from 0 to about 12 and the y value varies between +1 and -1, which in pixel co-ordinates gives you the small splodge!
You can use constants to scale and shift the graph to make it fit in with the current co-ordinate system if you want to.
This produces a reasonable sine wave, but a much cleaner method of plotting graphs is to make use of the transformation to provide the co-ordinates that we would really like to use.
We would like a co-ordinate system that varies between 0 and 12 in the x direction and +1 and -1 in the y direction. If we assume that the canvas is 400x400 then the change in the co-ordinate system can be created using:
First we scale so that the x axis runs from 0 to 12 and the y axis from 0 to 2. Then we translate so the y axis runs from -1 to 1.
The only complication is that that the transformation affects every measured aspect of the drawing, including line width. So we have to reduce the line width back to roughly one pixel expressed in the new co-ordinate system.
In Chapter But Not In This Extract
Stack of States
Active Transformations and State
Summary
Transformations include rotation, scaling and translation.
You can write all three as a simple matrix if you use homogeneous co-ordinates (x,y,1)
You can set the transform matrix directly or use one of the utility methods to set scaling, rotation and translation.
The order in which you apply transformations makes a difference.
You can think of transformations as actively moving something or just changing the co-ordinates. Canvas transforms change the co-ordinate system.
If you want to think “actively” then think of the transformations you want to perform on a shape and then apply them in the reverse order before drawing the shape.
One approach to organizing graphics is to draw everything centered on the origin and at unit scale and then use transformations to size, rotation and position where you really want to draw the shape.
You can change the co-ordinate system in use to anything that suits the current drawing task.
You can save the drawing state before changing the co-ordinate system so that it can be restored.
The drawing state includes the current transformation matrix, clipping region and all drawing attributes.
Now available as a paperback or ebook from Amazon.