| Google Helps With Linux Scheduling With SchedViz |
| Written by Harry Fairhead | |||
| Thursday, 10 October 2019 | |||
|
Google has just open sourced a tool that lets you visualize how your program is being treated under Linux scheduling. The idea is that you can use SchedViz to tune the system. We all know the best scheduling algorithm to use - my program runs, everything else is suspended. Effective, but not cooperative. To achieve the same result while allowing other programs a chance to use the CPU we need to tune, and perhaps even select, the scheduling algorithm. The problem is that the basic Linux tools to do the job are lacking and what generally happens is that you guess what might be best. In a modern system such a guess is unlikely to be correct because there are too many variables. Each thread has a priority and these interact under the scheduling policy. It can make a difference which core a thread is assigned to and changing cores is something best avoided. SchedViz makes use of the built-in ability of the Linux kernel to stream debug data to a buffer. It then uses the data in the buffer to show you the details of how threads are started and stopped. You run a command line script to capture the data for a specified time and then load it into SchedViz for as much analysis as you care to apply. You can also keep saved traces to compare any modification you make. At the moment SchedViz can:
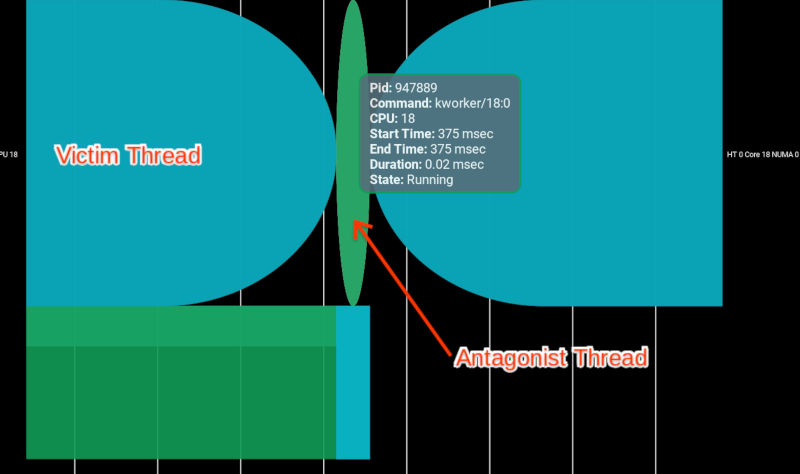
The blog announcing the tool describes antagonist analysis: "Antagonism describes the situation in which a victim thread is ready to run on some CPU, while another antagonist thread runs on that same CPU. Long antagonisms, or high cumulative duration of antagonisms, can degrade user experience or system efficiency by making a critical process unavailable at critical times." SchedViz lets you look at a chart and see what thread is keeping your important thread from running:
Another problem the tool can help with is allocating threads to particular cores. In a modern machine not all cores have the same access to memory - NUMA - Non-Uniform Memory Access. This is not an easy area to understand and not everyone is going to want to try and optimize something this complicated. Most of the time locking your process to a particular core and discovering what else is using that core is all you really need but this is likely to change as the typical number of cores increases. This is a useful tool, especially if you are trying to optimize IoT or realtime processes. I'm keen to see what it makes of deadline scheduling. It is early days for SchedViz and there are plans to add additional features to analyze related behavior such as interrupt handling.
You can find the code over on GitHub.
More InformationUnderstanding Scheduling Behavior with SchedViz Related ArticlesApplying C - Deadline Scheduling Microsoft Open Sources AI Debugging Tool Firefox Gets Time Travel Debugging Debugging and the Experimental Method Reversible PHP Debugger Released To be informed about new articles on I Programmer, sign up for our weekly newsletter, subscribe to the RSS feed and follow us on Twitter, Facebook or Linkedin.
Comments
or email your comment to: comments@i-programmer.info
<ASIN:1871962455> <ASIN:1871962463> <ASIN:1871962617> |
|||
| Last Updated ( Thursday, 10 October 2019 ) |


