| How much am I downloading? |
| Written by Ian Elliot | ||||||
| Saturday, 17 January 2009 | ||||||
Page 2 of 2
Using PRTGOnce you have finished the installation you can move on to using PRTG. You can run it automatically at the end of the installation. You can find a link to the log in page in the Start menu or you can simply type in the machines name or its IP address into a browser. If you have changed the port number remember to type :port number after the URL. For example, if the machine is called MyMachine and you installed to port 123 you would use; http://MyMachine:123 Once you have the browser started simply log in using the credential you set earlier. Once you reach the opening page the temptation is to click the “Run Auto Discovery” button. This scans your network to see what devices are connected to it. This works really well and it does find nearly all devices that will respond to a “ping” and it installs lots of sensors to monitor them. If you have a largish network and you want to monitor it in detail then Auto Discovery is great. However if you only have a few machines and want to start your network monitoring by specifically monitoring the router it can use up your 10-sensor allocation all too quickly and this makes it difficult to refine the setup. In this case it is much easier to manually add the sensor for the router manually. To do this click the Add New Sensors button and then Create a new Device on the next page and click Continue. Add the new device to a new group or the existing default group as you please – you can change your organisation later. On the next page simply give the device a name, e.g. Router, type in its IP or DNS address and select "Automatic device identification". As long as the router supports SNMP all of its possible sensors will be automatically detected and added to the monitoring program. If it doesn’t support SNMP then there are ways of adding a sensor but to be honest it is probably going to be cheaper in the long run to simply go out and buy a router that supports SNMP than try to fix the problem any other way. As long as the router supports SNMP you will eventually see it added to the group that you selected and its sensors will be listed.
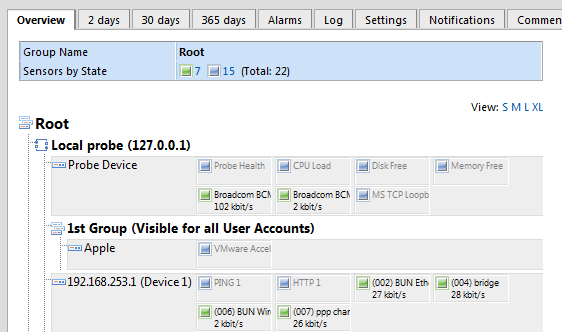
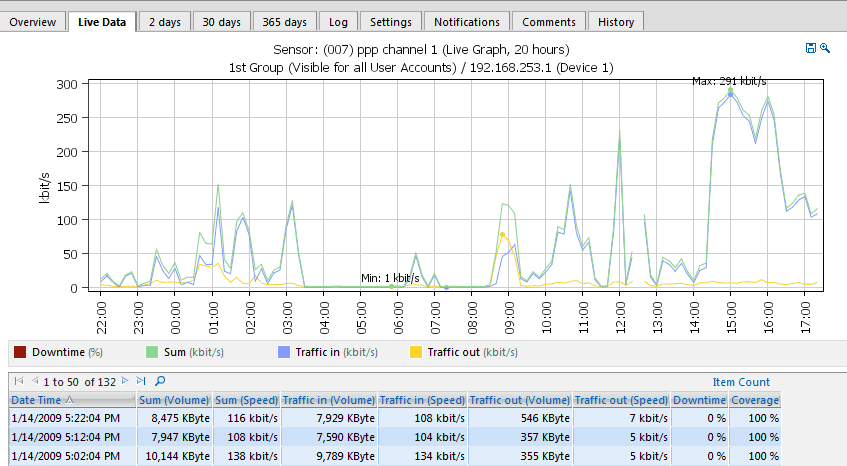
The sensors that you see vary according to the device type but roughly you can expect to see a sensor for each type of data transfer the device supports. In the case shown above the router reports the traffic on its Ethernet ports, its WiFi port, a bridge connection between the Ethernet and the Internet and a PPP Internet connection. In many cases it will be difficult to determine which sensor corresponds to which network connection type. The simplest way to find out is to monitor data flow and start a largish download from the internet. The sensor that shows the largest change is monitoring the Internet data. Notice that the Ethernet sensor will also go up but because its data is the Internet data plus local network data it will show a higher data rate. If you are lucky then you will find a sensor that shows only the data going to and coming from the Internet. Again if not, crazy though it sounds, it's easier to buy a router that supports this level of SNMP. There is one small complication in that when you look at your newly installed sensors they will probably be shown as blue which means not in use. The problem is that by default a set of seven sensors are used to monitor the machine that PRTG is installed on and this only leaves you three sensors to play with before you reach your 10-sensor limit. To activate any of the new sensors that interest you simply right click on the “Probe Device” sensors and select "Pause, Indefinitely" until you have enough free sensors to activate the ones you are interested in. To make any sensor work, up the limit of 10 working (i.e. green) sensors, right click, select "Pause, Resume". Notice that sensors turn orange if there is something odd about them, like a low data rate, and red if there is something very wrong such as a data rate that is too high. Discovering the data rate and moreNow you are ready to find out how much data you use. Clicking on the sensor that you have identified as the internet sensor you can see a page that lets you view its status and clicking on the “live data” will show you a chart and table of data. This is gathered by default at one minute intervals and you might want to slow this down to something more reasonable for the purpose – use the Settings tab.
From this point on you can explore the facilities offered by PRTG as they are well documented and/or obvious. You can add sensors to monitor the network usage of any machine on your network, free RAM, disk space and so on. You can also check that machines are still working using Ping, check that particular services such SMTP, POP3 and so on are still available. You really can find out what your network is doing. If you do go on to add more sensors then the biggest problem you will have is installing WMI based sensors. WMI is a great idea but the needs of security have made it next to impossible to make work as there are so many different places that it is blocked. It's not impossible to make it all work but it is well beyond the scope of this simple introduction to finding out where the data is going. Routers that support SNMP Traffic monitoring The D-Link DSL-G804V <ASIN:B000FDK9YY@DE> The D-Link DSL- 2740B (Europe) <ASIN: B000FL8NXK@UK><ASIN: B000LC510G@FR@DE> The VigroPro 5510
Routers that don’t
|
||||||
| Last Updated ( Monday, 12 April 2010 ) |

