| Monitor Mobile |
| Written by Ian Elliot | |||
| Thursday, 05 June 2014 | |||
Page 2 of 2
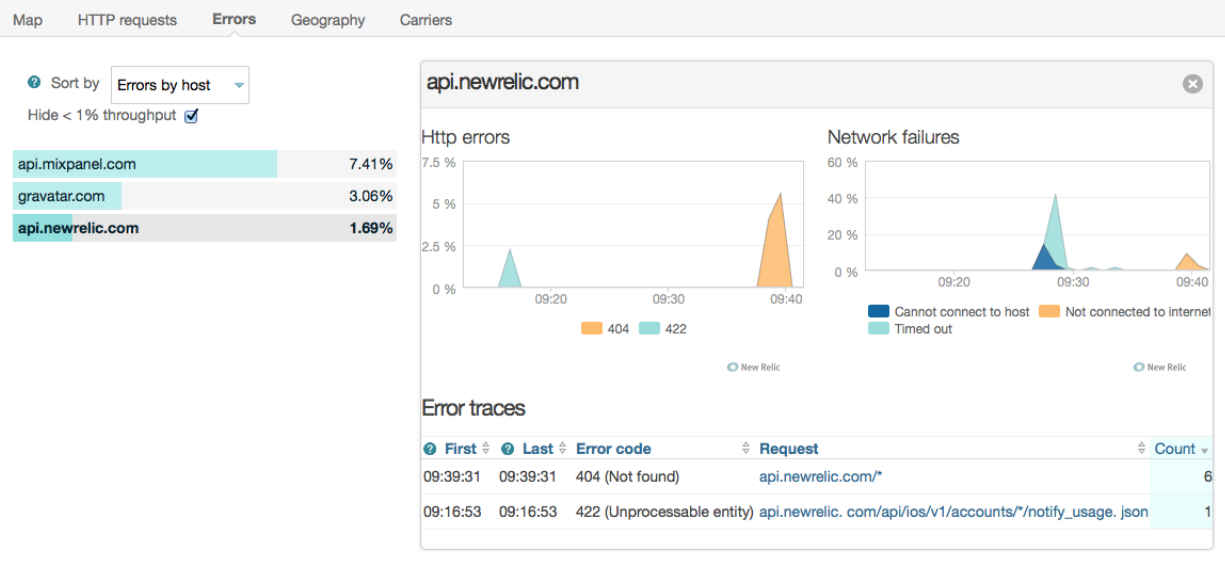
Network DataThe HTTP Requests Dashboard lets you focus your attention on the way your app is communicating with any backend infrastructure you might be running. It gives you HTTP response time and errors. You can even drill down to a particular error to see the application error messages and Android will provide a stack trace. A nice touch is the ability to look at how things are working by geographical region. This can help figure out when there is a temporary problem but is it more likely to be useful if you are thinking of adding an additional server in a given region. You can do the same sort of analysis by carrier but this is likely to be of mostly theoretical interest - I guess you could tell your users that it is their carrier causing the slow down on you blog or support site.
The amount of information that you get is a bit overwhelming at first in the sense that you keep on discovering something new as you use the dashboard. If you put the mobile data together with the server monitoring then you can see both ends of what is going on and pin down who's fault it is - client or server. Custom DataIt is remarkable that so much data can be collected with so little change to your code. However, there always comes a time when you think you need to know something else. You can add custom metrics to the data very easily. In Android (iOS is similar) all you have to do to create a custom metric in the specified category and assign it a name and a value is to add:
Of course, you wil have to write some code to determine what the value is, but it is your custom data and so you should known how to obtain it. There are more advanced custom metric API calls, but they are just as easy. You can view your custom metrics on a custom dashboard which is also easy to create. AlertingFinally you can set up alerts to wake you up at any time of the night when your app isn't performing - HTTP error rates, Network failures and response time limits can all trigger an alert. The idea of triggering and alert isn't something that is necessary for all apps and even apps with extensive servers support would most likely be better arrange to monitor the server and issue a server alert. Where app alerts come into their own is if you are using a third party server that isn't under your control or a complex and changing set of servers that make it easier to monitor the app. This is an area of monitoring you have to think quite carefully about. The bottom line has to be that you get a lot of information for very little effort - yes you could do it from scratch but why bother when you'd have to do so much more work for a less comprehensive solution. The ability to tie together the server monitoring and the app monitoring is, for me, the killer feature of New Relic's system.
To be informed about new articles on I Programmer, install the I Programmer Toolbar, subscribe to the RSS feed, follow us on, Twitter, Facebook, Google+ or Linkedin, or sign up for our weekly newsletter.
More InformationRelated ArticlesGetting Started With Azure Linux VMs The Appliance of...Virtual Machines
Comments
or email your comment to: comments@i-programmer.info
|
|||
| Last Updated ( Thursday, 05 June 2014 ) |