| Deep Monitor Your Site |
| Written by Ian Elliot | |||
| Thursday, 08 May 2014 | |||
Page 1 of 2 How can you find out how your dynamic web site is working? The answer is to add some sort of monitoring and the temptation to do it yourself should be resisted at all costs. You have better things to do and that particular wheel has been invented.
I had noticed New Relic as a company that provides application monitoring as a service. So when I needed to find out how a PHP web app was performing, first to check that the architecture worked well enough and with a view to to long term monitoring and management, I thought I'd try out New Relic APM, its application performance management solution.
Monitoring As A ServiceThe idea of application monitoring as a service is a logical one. The idea is that you instrument the server with some standard agents. The agents collect data and send it to the monitoring servers and they organize it and present it in a form that you can digest. For the particular problem I needed to solve the idea of a central data collection point was a good fit because the application used servers hosted both on Azure and a local site. There was also the possibility of needing to profile an additional server on AWS. So having a single central dashboard seemed like an attractive proposition. There are agents for Ruby, PHP, Java, .NET, Python and Node.js. There is also support for particular frameworks within each language group. Five Minutes To DataThe system to be monitored in this case was a custom PHP application, but the New Relic web site still claimed that I could be up and monitoring in five minutes. Given the usual problems you can expect when configuring systems this seemed a bit optimistic. To try things out a I made a copy, an Azure image, of one of the servers. Once up and working it was simple to swap this with the production server. The usual way to work with an Azure Linux server is to use the command line and setting up this and the rest of the server wasn't included in the five minutes! You also have to sign up to New Relic to get a licence key - this is used to make sure that the data transferred is secure and you have to use it to setup the agents on your server. So armed with my account and my key I made a start on installing the agents to see how quickly it could be done. The details are slightly different depending on which operating system you are using. For Debian based systems, e.g. Ubuntu, all you have to do, assuming you are logged in as root, e.g. for Ubuntu sudo -s, is: 1) Get the key so that data exchange is secure:
2) Next create a file containing a single line and this can be done with a single command:
4) Use the install script:
The installer asks for the license key so don't walk away leaving it to get on with the job.
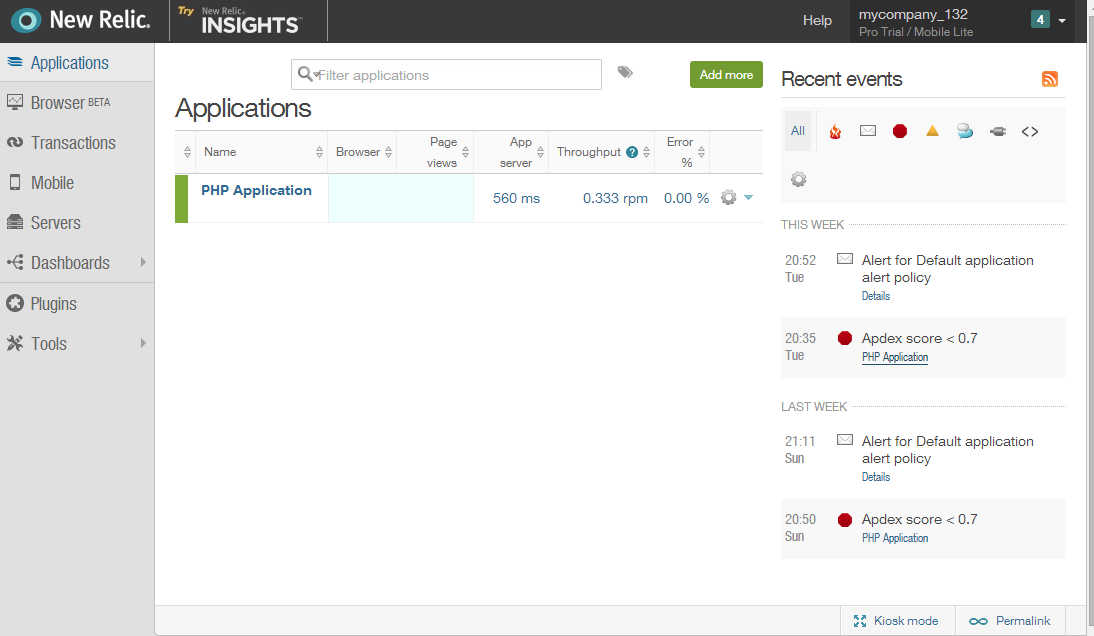
5) Restart the web server. Yes it took less than five minutes. First DataOnce the agent is installed you can view your Dashboard and start to see how things are running. It takes a few seconds for enough data to be gathered to draw some charts so you need to be patient. If it doesn't work, and configurations can be complex enough to fool any installation script, then manually editing things so that it all works is fairly easy, but it probably will take you longer than five minutes.
When you first see the dashboard you are only likely to see one app on display, but one of the big advantages of the system is that you can monitor multiple apps. If you want to add another simply click the Add button at the top or go through the same steps that you used for the first server. If you select your application then you will see multiple charts and data.
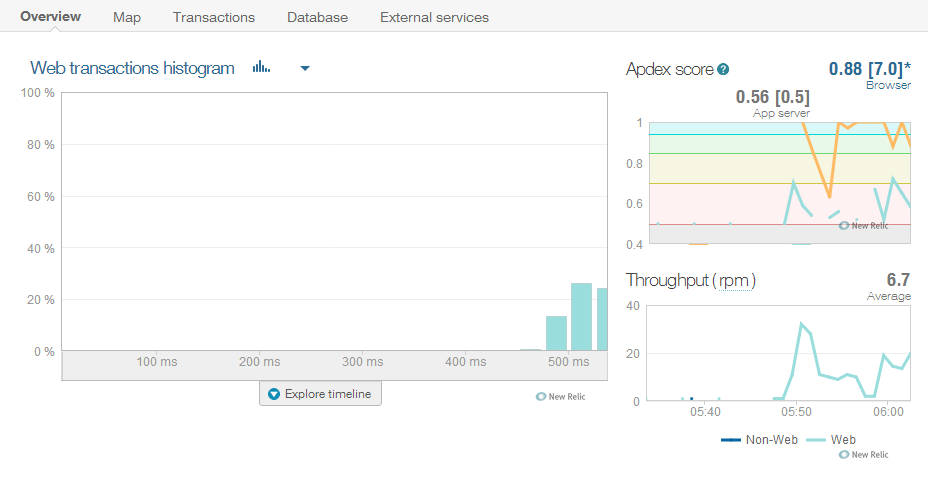
What you get out of the monitoring data depends on all sorts of factors but it is worth discovering what metrics are available and what they mean. Don't expect to understand it all in one glance although you will understand the obvious data relating to response times in milliseconds and the throughput in requests per minute rpm. ApdexThe chart that might need some explanation is the Apdex (Application Performance index) score. This is an open standard designed to measure how satisfied with your site users are. A value of 1 indicates that all users are satisfied and a value of 0 means that none are. The index is computed using the idea that a page might satisfy the user, be tolerated or be unsatisfying. Tolerated pages are treated as if they contribute half a vote to satisfying and half a vote to unsatisfying, i.e. they are neutral. The index is computed as:
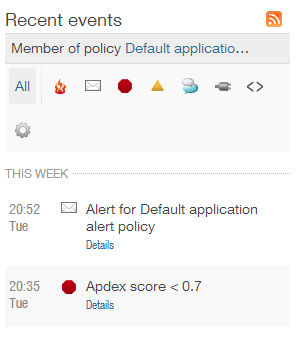
The final part of the Apdex formula is what constitutes a satisfying page delivery. The index uses a target time T for page delivery as long as the page is delivered within the target time then you have a satisfied user. If it takes up to 4T the user tolerates the page delivery and at over 4T they are unsatisfied. In addition any any error pages are, very reasonably, counted as unsatisfied. By default the Apdex time is 0.5s by default, but you can change it by clicking the Settings tab. The Apdex score is a remarkably good indicator of your site's health. Anything that slows it down from a database problem to a bad URL or a traffic spike will show up as a low Apdex score. You can see a chart of the Apdex score over time and if it falls below 0.7 for 5 minutes an alert is generated which can be sent by any combination of email or mobile. You can customize the thresholds and time intervals. As well as the Apdex score, the raw error rate is plotted and you are alerted if this exceeds 5% after 3 minutes - again you can customize this threshold. The health of your app can be seen in the "traffic light" display at the bottom of the Overview page including "caution" states which can be customized.
|
|||
| Last Updated ( Thursday, 08 May 2014 ) |