| The Dance Of The Programming Languages |
| Written by Janet Swift | |||
| Wednesday, 18 September 2019 | |||
|
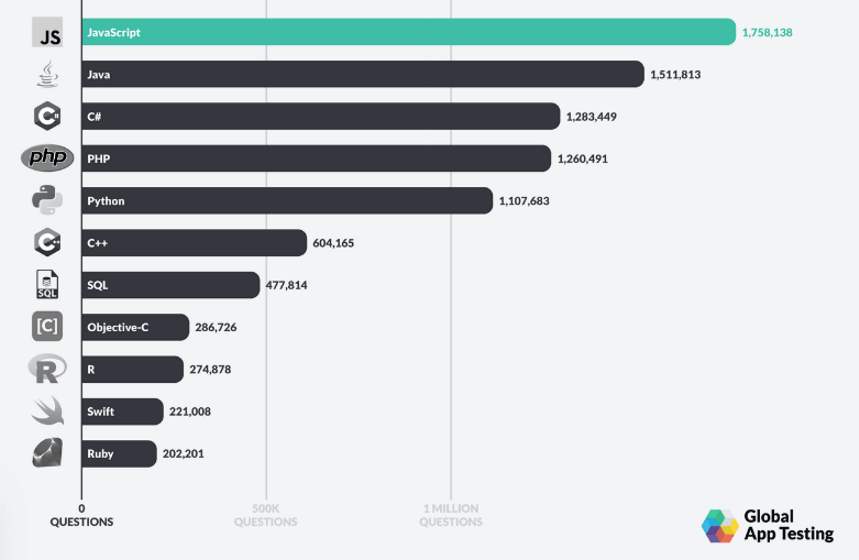
An animated chart that has been shared with several Reddit R Programming communities over the past few days provides an interesting overview into how programming languages have competed for attention over more than a decade. Having covered the IEEE Spectrum rankings of top programming languages only last week, I had meant to turn my attention to topics other than language popularity for a while. However, this animation from Global App Testing using Stack Overflow data is just too good to overlook and I make no apology for sharing it with you. The chart makes its most recent appearance on r/dataisbeautiful, a sub-reddit that is for visualizations that effectively convey information. Click on image of video to watch it on r/dataisbeautiful The original source of the video was the Global App Testing Blog where it was part of a long post titled Picking Apart Stack Overflow by Nick Roberts who explains that it is based on the relative number of Stack Overflow questions for each of 11 programming languages. According to the uploader, qaops, who also created the visualization the data was parsed using Pandas (a Python library), then visualized using D3.js (a JavaScript library) and finally, touched up in Adobe After Effects (graphics rendering software). One of the comments already made on r/dataisbeautiful is: This is slightly misleading - it's not how popular each language is, it's how many questions/answers are posted relating to them on Stack Overflow which is very much NOT a popularity vote. This is indeed a valid comment. However, Stack Overflow Qs is one of the components used by other rankings looking for the "top" programming language, such as the IEEE Spectrum Interactive Rankings and RedMonk's popularity analysis and watching the animation it seems to represent trends over time quite well. Another chart in Nick Roberts' post is of the total number of questions on Stack Overflow for 11 popular languages from 2008. It puts JavaScript well in the lead above Java in second place and is used as the list of languages that appear in the video. In fact two other languages are included in the video - Perl, which starts out in 10th place, drops out at the end of 2008 and only bounces back once. C starts in #8, and while it only drops out very briefly never climbs into the top half of the table, despite the fact that other rankings show it consistently in the top 5. This is more to do with Stack Overflow tags and the difficulty of disambiguating C and C# - and also may explain why the language that starts in the top slot is C# a position it keeps until March 2012. It then drops to #4 where it achieves stability until 2016 when it is overtaken by Python. Python, having bounced around in the lower half of the chart until mid 2012 surpasses C++ to take #5 until it starts an almost smooth run for the top in 2016, finally ousting JavaScript, which was #1 almost continuously from July 2013, only in November 2018, which is where the data runs out. R makes its very first appearance in March 2014 when it briefly dislodges Ruby from #10. It next appears in September 2014, only to be knocked out by Swift, By 2016 R is firmly in the lower half of the league but it never makes it above #6. Swift meanwhile having climbed to #7 in October 2015 ends up in #9. I've had fun watching the way the languages engage in a dance accompanied by a rather effective sound track. I hope you'll enjoy it too. Thanks Global App Testing for crunching the Stack Overflow data.
More InformationRelated ArticlesPython Set To Be Top Language (TIOBE) Why Do Some Languages Always Come Top? (RedMonk) Why Is C Top Language In IEEE Ranking? To be informed about new articles on I Programmer, sign up for our weekly newsletter, subscribe to the RSS feed and follow us on Twitter, Facebook or Linkedin.
Comments
or email your comment to: comments@i-programmer.info |
|||
| Last Updated ( Sunday, 16 March 2025 ) |


