| Visualizing Language Migration Over Time |
| Written by Janet Swift | |||
| Friday, 14 July 2017 | |||
|
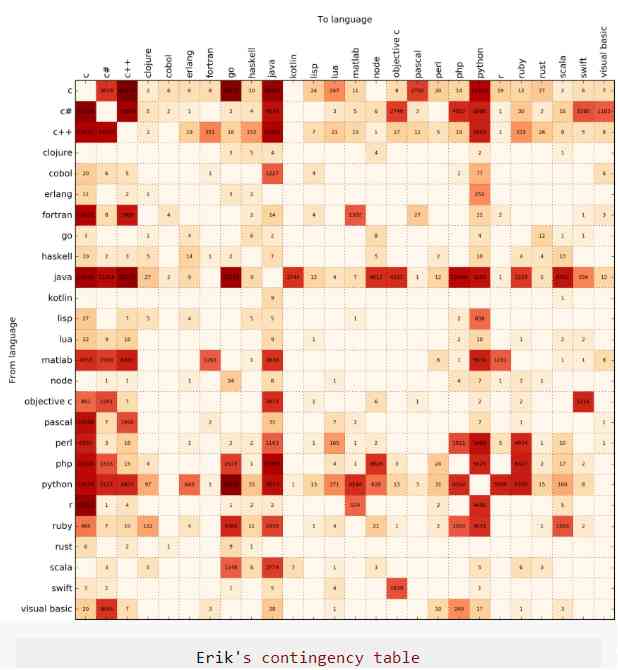
It's not unusual for experienced programmers to switch from one language to another. This could be to handle the requirements of different projects or just to try out new options. Whatever the reason there's quite a lot of migration, both temporary and permanent. Given I Programmer's Interest In all computer languages, a recent post by Waren Long, a Machine Learning Intern, on the source{d} blog tackled a very relevant topic - developers changing the languages they code in over a time period starting in 2000 and spanning 16 years. The approach used was as fascinating as the result themselves and Long provides a lot of detailed math and statistics that is well worth reading about from a data science point of view. The scripts used, for the analysis and the blog post itself are all open source and available. The inspiration for this study of GitHub code was a blog post in March this year from Erik Bernhardsson who, in The eigenvector of “Why we moved from language X to language Y” tackled the question: Is it possible to generate a N * N contingency table of moving from language X to language Y? Bernhardsson's analysis was on Google queries related to changing languages and covered 25 languages. The one glaring omission from the list of languages was JavaScript which Erik explained with two reasons: “(a) if you are doing it on the frontend, you are kind of stuck with it anyway, so there’s no moving involved (except if you do crazy stuff like transpiling, but that’s really not super common) (b) everyone refers to Javascript on the backend as ‘Node’”. Our data retrieval pipeline could not distinguish regular JS from Node and thus we had to exclude it completely.
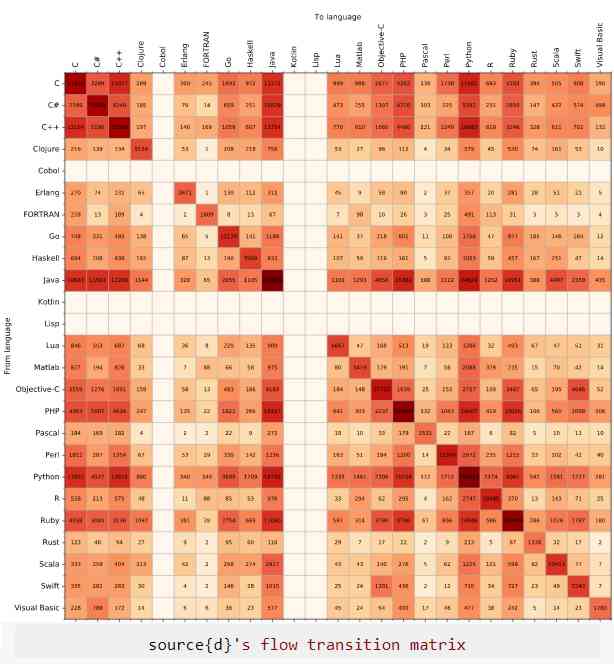
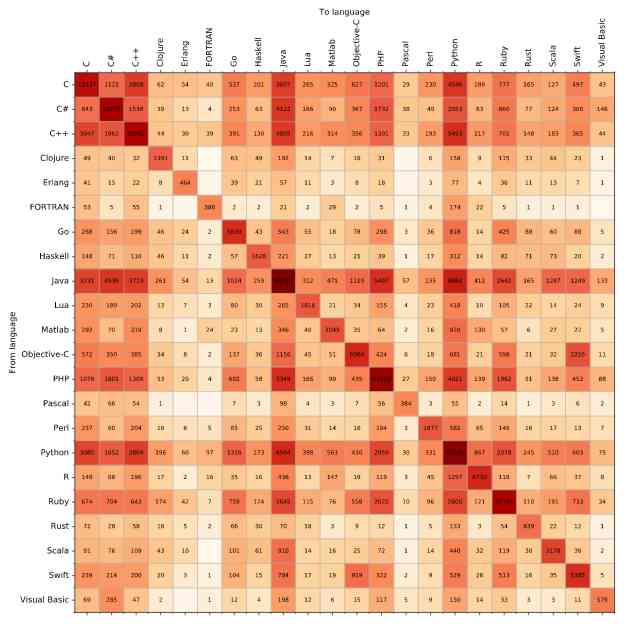
Some preliminary analysis was done to eliminate "Hello world" GitHub repositories from the dataset and then a transition matrix was computed between consecutive years for GitHub users and summed over users and over the last 16 years. The results were plotted on a grid using Bernhardsson's script, which makes it easy to get an overview of the differences, and similarities between the two results.
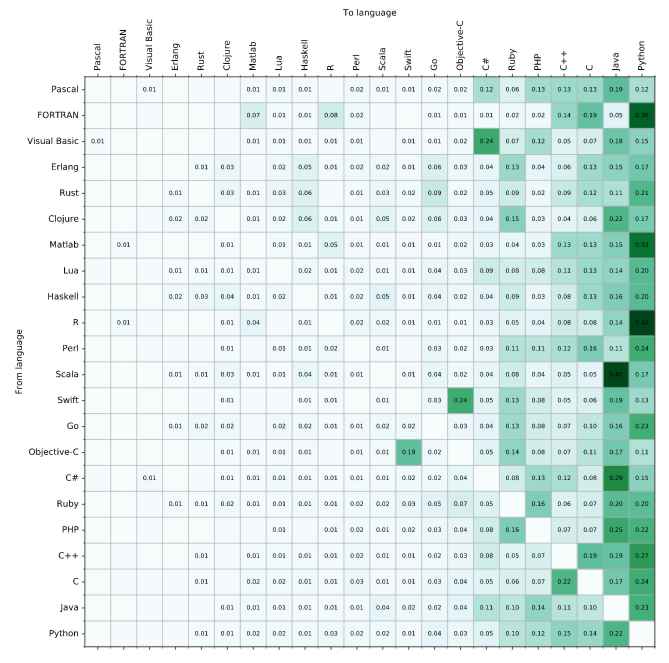
The two grids list the languages in alphabetical order and empty rows and columns in the source{d} matrix are those for Cobol, Kotlin and Lisp where were not found in the GitHub data. Although the numbers in the two grids are very different, the shading is based on a logarithmic scaling from 1 to the maximum value - so represent density. The other big difference is that, whereas the diagonal in the contingency table is blank (you can't consider switching from language X to language X), in the flow transition matrix it isn't. In fact it always contains the most dense shade in both its row and column and represents those who don't switch language and use the same one from year to year. In his comparison of the popularity of languages across the two analyses, Long writes: Python (16.1 %) appears to be the most attractive language, followed closely by Java (15.3 %). It’s especially interesting since only 11.3 % of all source code on GitHub is written in Python. In Erik’s ranking, Go was the big winner with 16.4 %. Since Erik based his approach on Google queries, it seems that the buzz around Go, which makes people wonder explicitly in blogs if they should move to this language, takes a bit of time to produce projects effectively written in Go on GitHub. Furthermore, C (9.2 %) is doing well in accordance with Erik’s grading of 14.3 %, though it is due to the amount of projects coded in C on GitHub. Although there are ten times more lines of code on GitHub in PHP than in Ruby, they have the same stationary distribution. Go (3.2 %) appears on the 9th position which is largely honorable given the small proportion (0.9 %) of Go projects which are hosted on GitHub. For example the same proportion of projects are written in Perl, but this language doesn’t really stir up passion (2 % popularity). Popularity ranking, with most popular language at the bottom, is used for this visualization. The following transition matrix shows the proportions of GitHub users going from language X to language Y and vice versa. So for example it shows that 40% of Scala users switch to Java, whereas 4% of Java users switch to Scala. If you sum the proportions they will fall short of 100%. The shortfall is the proportion who stick with their language year on year.
Picking out noteworthy points, Long comments:
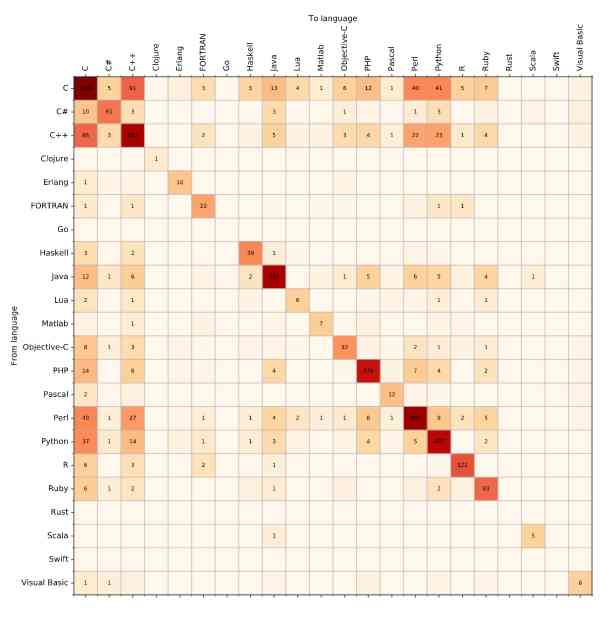
Long picks out four matrices from different timeline intervals which he notes show the same language profile every year, i.e. the deepest shades in the same positions. Here are two from a decade apart, 2005-2006 (with many fewer languages) and 2015-2016.
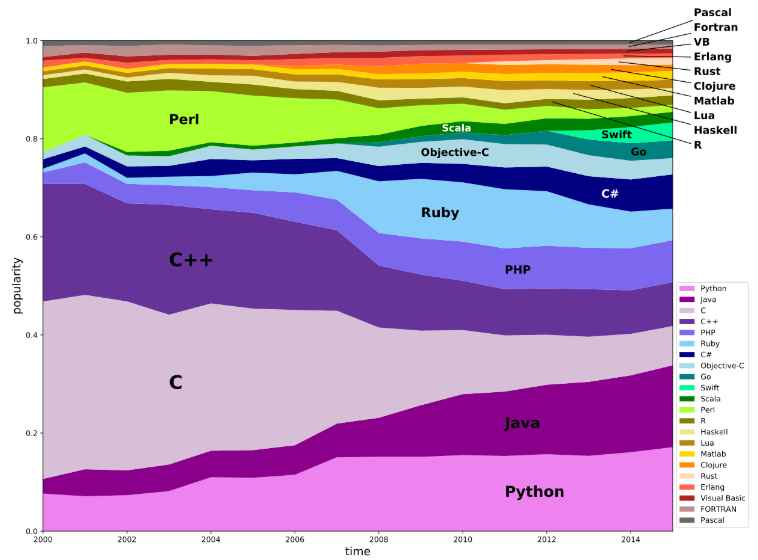
Finally to put all the data about language useage together Long produces this chronological sequence in which the thickness of each band corresponds to the value in the dominant eigenvector. Long comments:
To understand the final comment you need to know that Go emerged as the front runner in Bernhardsson's analysis, to which he commented: Surprisingly, (to me, at least) Go is the big winner here. There’s a ton of search results for people moving from X to Go. I’m not even sure how I feel about it (I have mixed feelings about Go) but I guess my infallible analysis points to the inevitable conclusion that Go is something worth watching. Go is a language there is a lot of hypothetical interest in. Whether it really is the language of the future can be the subject for a repeat analysis at some point in the future.
More InformationAnalyzing GitHub, how developers change programming languages over time The eigenvector of "Why we moved from language X to language Y" Related ArticlesGo Language Of The Year With Dart Catching Up Most Popular Computer Languages 2015 JavaScript Is The Language Of 2014 Programming Languages An Infographic To be informed about new articles on I Programmer, sign up for our weekly newsletter, subscribe to the RSS feed and follow us on Twitter, Facebook or Linkedin.
Comments
or email your comment to: comments@i-programmer.info |
|||
| Last Updated ( Friday, 14 July 2017 ) |

