| Developing with PHP and Eclipse (Galileo) |
| Written by Ian Elliot | ||||
| Sunday, 05 July 2009 | ||||
Page 3 of 3
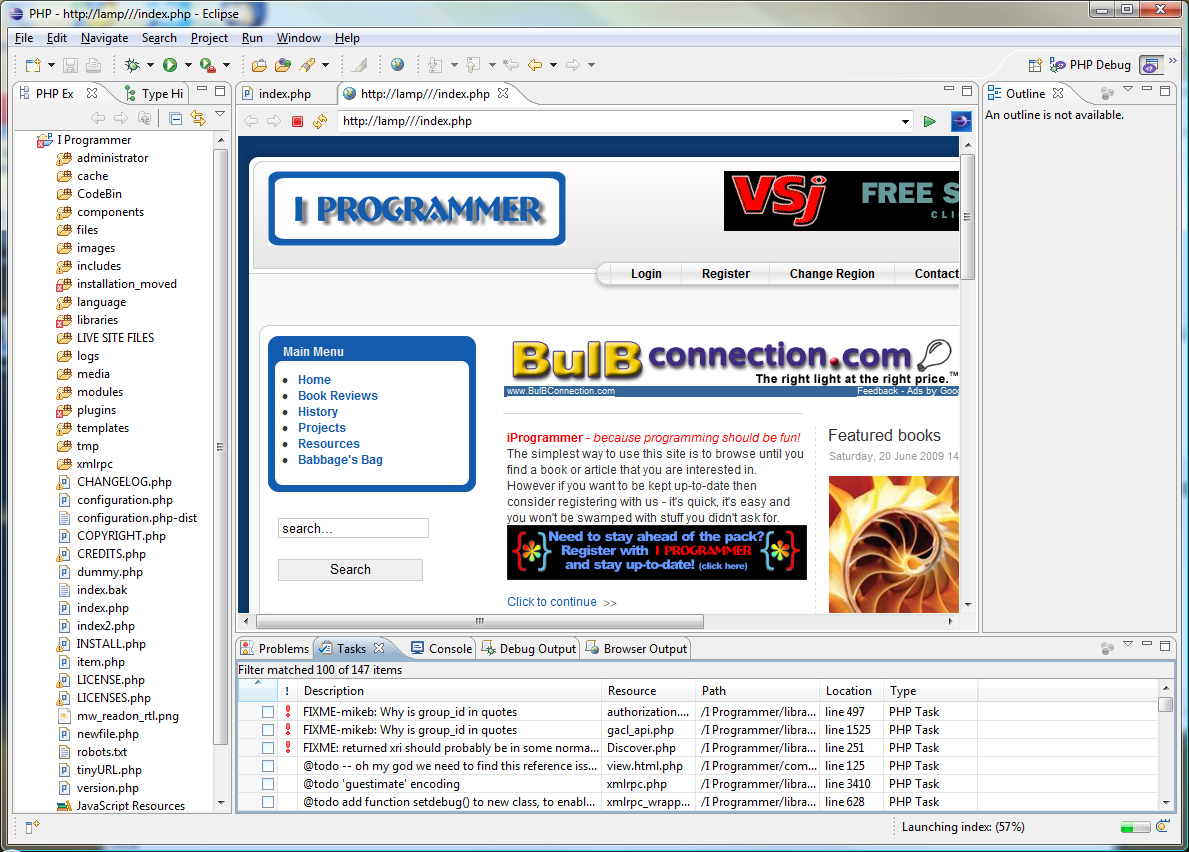
A first runTo try things out load index.php, or any PHP file that creates a complete web page, into the editor - simply double click on the file in the Project tree. Next select Run,As PHP Web page and you will see a potential problem. The launch dialog indicates that it is going to use the local web server "localhost". This is fine if you set the development site up this way, but if you installed the web server on the remote machine it isn't going to work. You could now install the same web server on the local machine and reconfigure everything, but it's easier to change the default server. Select Windows,Preferences and navigate to PHP Servers. Select the Default PHP Web Server and click on Edit. Change the URL to the remote machine. (Notice that there is also a Project,Properties dialog which sets a range of seemingly similar features and often seems to be confused with Preferences.) 
When you try to run the index.php file you should discover that the correct launch URL, i.e. the one you would type into a browser to access the page, is shown in the dialog box. If it isn't simply type the changes needed into the box and continue. You should see the web page appear in a tabbed window within the Workbench. You can now click links and use it as normal viewing the pages in the Workbench browser. A run configuration has now been created for the page index.php and the initial URL will be correct when ever you run the page in the future. You can view and edit the configuration using Run,Configurations. Don't try anything more complicated until you have got the web site running.
A first run DebuggingYou already have a system that makes editing the website much easier but the real payoff comes when you also have a debugger running. To achieve this you need the Zend debugger which is often included with PHP installations. If it isn't then you can download a standalone copy from: http://downloads.zend.com/pdt/ Next you need to extract the appropriate dll (Windows) or SO (Linux) and the correct version depending on the version of PHP you are running (the compressed file contains a range of versions). A readme file is included and a test file called dummy.php. All you have to do is copy the dll or SO to a directory within the PHP installation (again it can be anywhere but this is convenient). To tell PHP where the debugger is you have to also edit the php.ini file to read: zend_extension=/etc/php5/ZendDebugger.so You need to modify the lines to reflect where the dll or SO is stored and to give the IP address of the machine running Eclipse. You can modify the connector port to be anything you choose but also make sure you have opened it in the Eclipse machine's firewall - if you don't you will see the "can't connect to server" message. If you are installing a local debug system you don't need the final three lines. Finally you need to copy dummy.php to the root of the website, usually the same directory as index.php, and restart the web server. Of course if you are using a remote web server as a development system you need to do all of this on the server. It's also a good idea to restart Eclipse. If everything is ok you should be able to load the index.php file, open the Debug configuration dialog box and click Test Debugger. You should see an OK message - if not then either you haven't copied the dummy.php into the server's root, you haven't copied the dll or SO into the correct directory or you have made a mistake in the php.ini file. For a remote debug you also might not have opened the port in the firewall. These are the only possibilities. If you do see OK then click Debug and you should find that a debug perspective opens and you can single-step through the PHP code. If you complete the PHP code then you will see both the output of the PHP in the Debug window on the far right and the results in the browser, either in a new tab or in the browser window at the far right. You are now ready to experiment with debugging Joomla. Some common questions that are worth answering before they are asked are: 1) You can set breakpoints both in the code that makes the page you start with and in any pages that are reached by following links from it. 2) You can see the output from the PHP in the Debug window. 3) The browser used as the "internal browser" is an instance of the default browser on the machine that Eclipse is installed on. Any more questions? Email me:Ian.Elliot@i-programmer.info 
|
||||
| Last Updated ( Monday, 30 January 2012 ) |