| Looking at Chaos |
| Written by Mike James | |||
| Saturday, 05 September 2009 | |||
Page 1 of 2
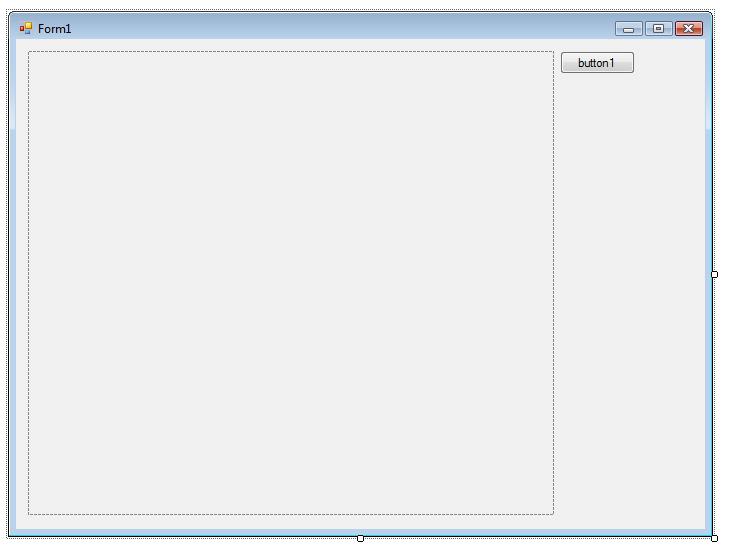
An article in Babbage's Bag is all about chaos and this seems like a good time to have some fun plotting some chaos diagrams and using the scrolling technique described in the recent project Stripchart Scrolling. The basic idea is very simple. The iteration x<-ax(1-x) is performed to see what values of x are generated for various values of the constant a. The values of a that are of interest are between about 2.95 and 4.00. For this range the iteration stays within the interval 0 to 1 and chaos sets in at about a = 3.5. When the iteration is started it takes some time to settle down and then it cycles though a finite number of values. The values that the iteration cycles though form the attracting set of the process and it’s these we need to plot. Start a new C# project and place a button and a picturebox on the form.
The form you need to show chaos
The button’s click routine does the work of plotting. First we need to make the pictureBox have a persistent drawing surface in the form of a bitmap: private void button1_Click(Next we work out a scaling that gives the correct range of values for to cover the entire picturebox: Double a; We then initialise x to some convenient value, the eventual result doesn’t depend much on what this is, and then iterate 500 times to allow transients to die away: Double x = 0.2; The next 500 iterations are used to find out what values of x occur in the iteration after the transients have gone: for ( int i= 1; i < 500; i++) Finally we Refresh the pictureBox and make sure to dispose of the Graphics object: pictureBox1.Refresh(); If you run this finished program you will see the bifurcation diagram for the map - see the next page. |
|||
| Last Updated ( Saturday, 05 September 2009 ) |