| Extending Firefox and Thunderbird |
| Written by Mike James | |||||||
| Saturday, 20 June 2009 | |||||||
Page 5 of 6
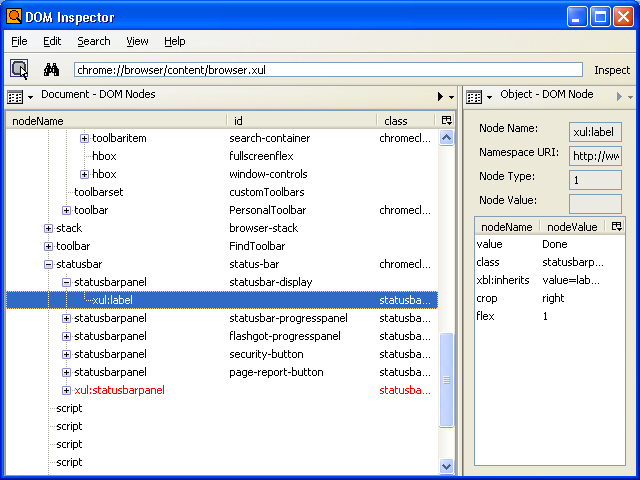
The DOM inspector and Java Debugger Now that you have the start of an extension the rest is just more of the same. You edit the XUL file to add controls to the user interface and you edit the .JS file to add behaviours. This is where the documentation leaves you to get on with the job. There is, however, more to know if the job is going to be easy. Firstly you need to meet the DOM Inspector. Installing this is an option when you first install FireFox so if you missed it reinstall FireFox, select custom install and select the DOM Inspector. You can also use the DOM Inspector with Thunderbird, only in this case the easiest way to do so is to go to the Extensions download page, search for DOM Inspector, download and install it. Once the DOM Inspector is installed you can start it running using Tools, DOM Inspector. You can use it to discover the type and id of any user interface control by simply clicking on the "button and arrow" icon in the top left and then clicking on the button, icon or menu item in FireFox. When you return to the DOM Inspector you will see the node in the DOM tree corresponding to the control you just clicked on. If this appears not to work check that you are inspecting the window that you are clicking in - use File,Inspect Window. From here you can investigate the DOM tree and discover everything you need to know about that particular part of the user interface. For example, if you click on the "button and arrow" icon and then click on the status bar in the Firefox window - the one that usually says "Done" - you will see it flash with a red border and when you move back to the DOM inspector you will see that this is a statusbarpanel with id statusbar-display which is a child node of a statusbar object with id status-bar. You can also discover that this has a child node xul:label with value "Done".
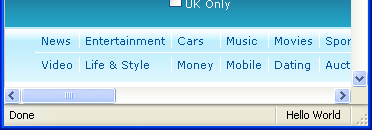
Armed with this knowledge we can now add our very own statusbarpanel to the statusbar. Just open the XUL file and change it to read: <?xml version="1.0" encoding="UTF-8"?> <statusbar id="status-bar"> The last four lines define an overlay for the existing statusbar with id "status-bar" by our own statusbarpanel with id "helloworld-statusHelloword" and a label to display. If you want to see more details about the statusbarpanel control simply look it up at: If you now save the XUL file, close all Firefox windows and reopen the browser you will see "Hello World" in the statusbar to the far right.
You can change the text displayed in your status bar using JavaScript in the usual way to interact with the DOM. For example, if you change the onMenuCommand method in the JS file to read: onMenuItemCommand: function() {
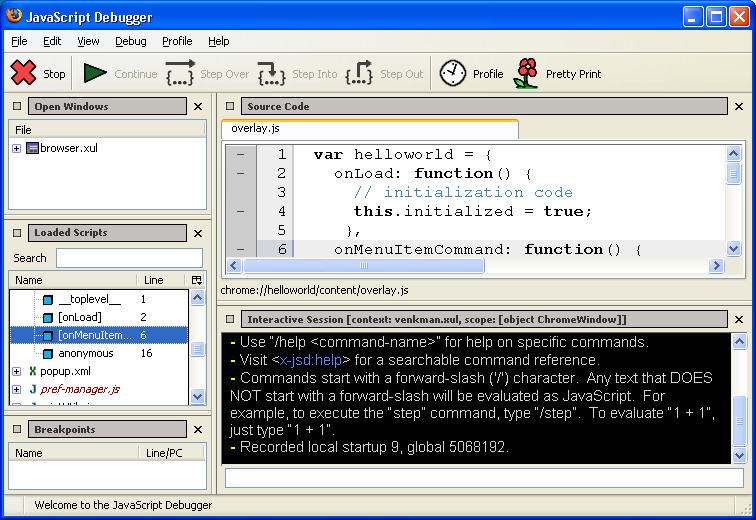
Then when you reload the extension not only do you see an alert box but after you have dismissed it the status line message changes. This example is very typical of how you work with controls - find your control in the DOM using getElementById or a similar function and then make use of its properties to change it. By this stage you should have the idea that in this case the DOM includes not just the web page being displayed but the entire browser user interface. The only thing that might puzzle you is how to get at the nodes of the web page being displayed because, as the last example demonstrated, document.getElementById doesn't work directly with the DOM of the loaded web page. The solution is that you have to use Content.document to get at the currently loaded HTML. The DOM inspector is your best way to discover the names of user interface components and to investigate its overall structure. Your second best friend is Venkman - the Mozilla JavaScript debugger. This works as an extension within either Firefox or Thunderbird and if you plan to create your own extensions you need to download it and use it to test and investigate your JavaScript. All you have to do is make sure that you are debugging the file browser.xul and then scroll down the loaded scripts until you find the name of the .js file for your extension - overlay.js in this case. This allows you to select any method defined in the file and set breakpoints and generally inspect how it works. If you can't find your JavaScript file even though your extension is loaded this means that the file contains a syntax error.
|
|||||||
| Last Updated ( Saturday, 27 June 2009 ) |


