| Silverlight Mandelbrot Zoomer |
| Written by Mike James | |||||||
| Thursday, 12 August 2010 | |||||||
Page 5 of 6
All that remains is the mouseup event handler and this is comparatively easy. It simply has to cancel the selection operation, make the rectangle invisible again and compute the new view of the Mandelbrot set using the new Rectangle: private void canvas1_MouseLeftButtonUp( To compute the new view of the Mandelbrot set we first need to convert the bitmap position as specified by selection into a Rect in terms of x,y co-ordinates. This is just the same calculation we have already performed in converting px,py to x,y in the drawSet method: double xscale = (area.Right-area.Left)/ Finally we can compute the new view: image1.Source = drawSet(area); Now the user can zoom in on any area of the set. Notice that because Silverlight is a persistent vector graphic system we don't have to worry about drawing and erasing the rectangle that indicates the selected area - the system takes care of it. All we have to do is set its position and size. Where next?With the program as described above you can go exploring the Mandelbrot set to your heart’s content. There’s a lot to see but be warned areas that are mostly blue take a long time to plot because these take the iteration loop to a full 1000 times around! The fact that the computation takes so long makes it an ideal candidate for running on a thread other than the UI thread. You may notice that the UI freezes when the set is being computed and the only way to keep the application responsive is to use a worker thread. When you are just trying to get it all working it is worth making the Image control small so that plots occur quickly. You can add some additional features to make the program more usable – a plot interrupt button, for example, a pan, and so on..
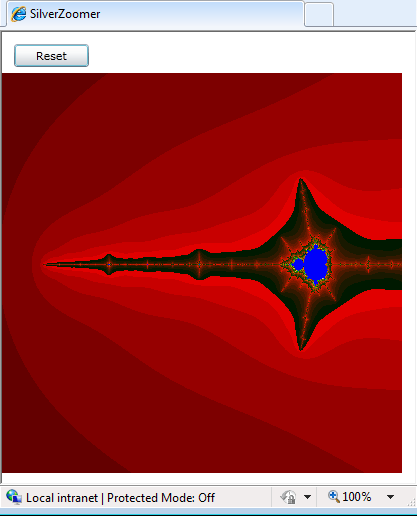
There are lots of interesting areas to explore.
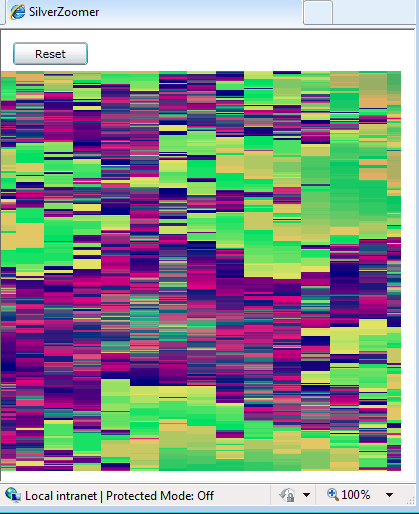
There is one small feature that I should warn you about before it wastes a lot of time when you try to “debug” the program. There are no limits on how far you can zoom in on any given region of the Mandelbrot set. You will discover that you can indeed use very high zooms but sooner or later you will select a very small region and the result will not look fractal but “blocky”. No you haven’t discovered that there is a limit to the structure of the Mandelbrot set! What is happening is that you have zoomed to the point where double precision variables aren’t accurate enough to represent the position of each point. The result is that you get the same answer for whole rectangular regions for the iteration and hence the blocky structure in the final plot. The solution to the problem is fairly simple – increase the precision - but this is easier said than done and you just hit another limit sooner or later. .
No not the end of fractals – you’ve just zoomed too far. To access the code for this project, once you have registered, click on CodeBin. On the next page you can try out a live Silverlight-embedded implementation. <ASIN:1430224819> <ASIN:0470477229> <ASIN:1430272058> <ASIN:1430272406> <ASIN:1430225394> |
|||||||
| Last Updated ( Monday, 30 October 2023 ) |


