| What is a Gantt chart? |
| Written by Andrew Johnson | |||
| Monday, 28 March 2011 | |||
Page 2 of 2
DependenciesNow that you have seen the way that basic Finish to Start FS relationship between tasks you can probably guess that there are others. Tasks can depend on each other in a number of ways and you can select these in the Task Dependency Type field:
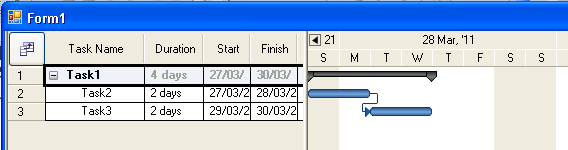
You can see that by creating tasks and linking them together with task dependencies you can build a model of how the tasks determine the overall behaviour of the project. You can take it further by assigning resources ot tasks and constraints such as a particular task has to be completed by a particular date and so on. The point is that the Gantt chart isn't just a chart. It is the visible surface of a project model. Because the user can interact with the UI it presents it is more than just a static chart because it provides a way for the user to create and interact with the model. The programmer's roleAt this point I hope you are impressed by this simple component. It has the power to keep your projects - whatever they are - on target or at least let you know very precisely why they are not! However as a programmer you might be thinking that its all been done for you. Why bother to use a Gantt chart component in your application? Why not simply get a project management application and use a complete solution? There are a number of very good reasons for preferring a Gantt chart component. The first is that project management programs are often very complex applications that take a long time to learn even if you only want to do fairly simple things. Then there is the issue of where the data is generated. If the details of tasks naturally arise within your application then presenting it in Gantt chart from and performing some simple modeling actions makes good sense. Everything that you have just been doing using the UI you can, of course, do in code. If you have used almost any sophisticated component you will already have a good idea how this is going to be done. There is a Tasks collection which you can use to add and generally access the task objects that make up the project. So for example, to add a task you could use something like: ultraGanttView1.CalendarInfo.Tasks.Add( Tasks themselves have a Tasks collection and this is how you create complex tasks consisting of sub-tasks. For example to create a task composed of two sub-tasks you would use: Task Task1 = new Task { Name = "Task1" };
You can also model the relationships between tasks using the Dependencies collection. For example to set the two sub-tasks to have a FS dependency you would use something like:
Task Task1 = new Task {Name = "Task1"};
You can see how this would continue to build a complex model of relationships between events. If this is all you need then - job, or should that be task, done! But it is worth pointing out that there are lots of sophisticated processes just waiting to be implemented in code. For example, sometimes tasks end and another cannot start immediately because it also depends on another task. This hiatus is called 'slack' and it is the slack in the project that is interesting because it sometimes allows tasks to overrun without effecting the entire project. It is also true that slack can be the source of inefficiencies - its where resources might stand idle. Then there is the best known of all project management concepts - the critical path - i.e the sequence of tasks that does determine the total time the project takes. The critical path is important because any delays to a task that is on the critical path delays the project. All of these concepts and more are fairly easy to take advantage of in code. You can make use of the Gantt chart and the model that it makes visible for all sorts of data analysis, costings, what-if simulations and so on. Some of these you will find in complete project management packages but now you have the power to tailor them exactly and provide data exchange and sharing with other applications. Gantt charts are fun - I hope you agree. Download a free trial evaluation of the Windows Forms controls, including the Gantt chart, from the Infragistics site. |
|||
| Last Updated ( Monday, 28 March 2011 ) |