| Understanding the Fourier Transform |
| Written by Stuart Riffle | |||
| Wednesday, 14 March 2012 | |||
Page 2 of 2
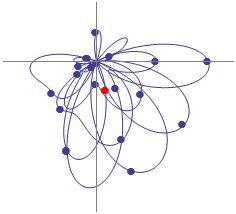
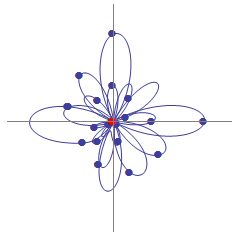
How can we quantify that? The easiest way would be to record a bunch of points as we rotate, and average them to find their midpoint:
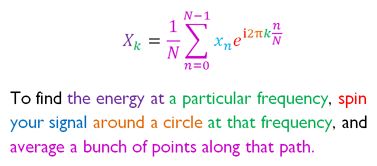
It makes sense that the distance of this midpoint from the origin is proportional to the strength of the signal, because as the high points in our signal get higher, they will move the scribble farther away. But what if the signal contains no energy at 3 Hz? Let’s remove the 3 Hz wave and see: Now there is nothing to pull the scribble off center, and all of the other oscillations tend to (approximately) balance each other out. This looks promising as a way to detect energy at a given frequency. Time to translate it into math! For a looping signal of N samples: Raising e to an imaginary power produces rotation around a unit circle in the complex plane, according to Euler’s formula. How? Magic, as far as I can tell. But apparently it’s true. So this equation is a little different from what we started with. I’ve added a normalization factor of 1/N, and changed the sign of the exponent. I also rearranged the terms slightly for clarity. This form is normally called the inverse DFT, which is confusing, but apparently the difference between the DFT and IDFT is a matter of convention, and can depend on the application. So, let’s call that close enough.
Anyway, once you can “see” what’s going on in your head, a lot of the quirks of working with the DFT become much less mysterious. If you’ve had to work with DFT output before, you may have wondered:
Hopefully this was more helpful than confusing. This article first appeared on #AltDevBlogADay and is used here with kind permission of the author.
Comments
or email your comment to: comments@i-programmer.info
To be informed about new articles on I Programmer, subscribe to the RSS feed, follow us on Google+, Twitter, Linkedin or Facebook or sign up for our weekly newsletter.
|
|||
| Last Updated ( Wednesday, 14 March 2012 ) |


