| A Generic SQL Performance Test Harness |
| Written by Ian Stirk | |||
| Monday, 16 January 2012 | |||
Page 2 of 2
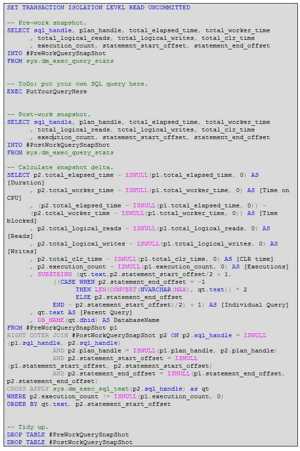
Click to see the listing with syntax coloring in a new tab:
SET TRANSACTION ISOLATION LEVEL READ UNCOMMITTED. The purpose of this is to ensure the SQL that follows does not take out any locks and does not honour any locks, allowing it to run faster and without hindrance. We take a snapshot of the initial state of the relevant DMV counters before we run the query under investigation. The values of these counters are stored in the temporary table named #PreWorkQuerySnapshot. Next we run the SQL query we are investigating, in my example it is a stored procedure named “PutYourQueryHere”, you should replace this with your own stored procedure or batch of SQL statements. After this SQL query has run, we take another snapshot of the DMVs counters and store them in a temporary table named #PostWorkQuerySnapshot. The difference in the values of the DMV counters, recorded in the snapshots either side of running our SQL query, will identify for each individual SQL statement run, important performance related metrics. Additionally, if the statements are not present in the #PreWorkQuerySnapshot temporary table we set any null values to zero, using the ISNULL function, allowing us to record the metrics for these queries. We join to the DMF sys.dm_exec_sql_text, passing it the sql_handle, to obtain the underlying SQL text the sql_handle related to. Appling the relevant offsets to this SQL text will allow us to obtain the individual SQL statement the DMV metrics relate to. To ensure we only output metrics about SQL statements that have run, we only include statements where the execution_count has changed, using a WHERE statement. The results of running this generic test harness are sorted by the SQL text (i.e. the stored procedure under investigation) and then the offset of the individual SQL statements within that stored procedure. Running this test harness on my server gives the results shown below:
One use of the generic test harness is to determine if your changes have improved the performance of your SQL queries. The output from the initial run of the test harness should be recorded, any improvements applied to the SQL query we are investigating (e.g. add an index), and the test harness run again. The output from both runs can be compared and summed to determine of the SQL query is now faster. Another use of the generic test harness is to identify which SQL statements are taking the longest time to execute, and here is where our potential improvements should be focused, for example, adding an index that relates to the statement that has the most reads. A side-effect of the sort order supplied (i.e. qt.text,p2.statement_start_offset) is it allows us to identify which statements have been executed and their order, this can be useful in identifying program flow and which statements have or have not been executed.This side-effect, in essence, provides a cumulative trace-like functionality, at an insignificant performance cost. It should be noted that the DMV snapshots will record metrics for all SQL queries that run between them, not just the query under investigation. Sometimes this is not a concern, since you will want to know how the different queries interact. If it is a concern, it is possible to get around this problem by running the SQL at a time when there is nothing else running on the server. Often, adding a relevant index will improve a SQL query’s performance. But how does the SQL Server optimizer know it should use an index? And how should it use the index (i.e. seek, scan or lookup?). The answers to these questions lie in the data statistics that relate to the distribution and density of the index’s column values. The use of statistics plays a central role in the performance of a SQL query, but that’s another article... ConclusionDMVs provide a quick and easy way to identify areas in your SQL queries where performance might be improved, and measure any subsequent performance improvements. There really are a great number of SQL Server secrets that DMVs can reveal. For further information, see my recent book SQL Server DMVs in Action which contains more than 100 useful scripts.
Related articles:Improve SQL performance – find your missing indexes Identifying your slowest SQL queries SQL Server DMVs in Action (Book Review)
Comments
or email your comment to: comments@i-programmer.info
To be informed about new articles on I Programmer, subscribe to the RSS feed, follow us on Google+, Twitter, Linkedin or Facebook or sign up for our weekly newsletter. |
|||
| Last Updated ( Monday, 16 January 2012 ) |


