| Discover How Web Apps Perform With Chrome User Experience Report |
| Written by Alex Armstrong | |||
| Wednesday, 25 October 2017 | |||
|
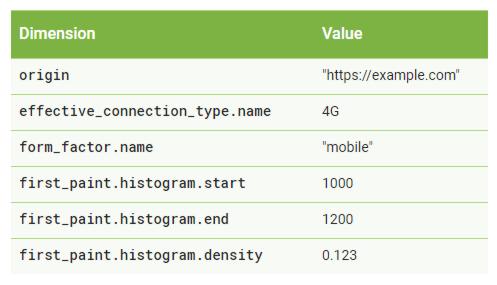
Unveiled at the Chrome Dev Summit in San Francisco, the Chrome User Experience Report is intended to let developers discover how their web apps perform in the wild by providing data collected from the top 10,000 websites. Introducing the new initiative, the Chromium blog states: Although current tools allow developers to understand how real-world users experience their own sites, they have never provided insight into comparisons with other sites or macro user experience trends across the web. To make such comparisons possible the Chrome User Experience Report is a public dataset, on Google BigQuery, of measurements related to user experiences currently including page load metrics, specifically First Paint, First Contentful Paint, DOMContentLoaded, and onload. All performance data included in the report is from real-world conditions, aggregated from Chrome users who have opted-in to syncing their browsing history and have usage statistic reporting enabled. The initial release is for a sample of ten thousand websites. To access the dataset, you’ll need a Google account and to have created a Google Cloud Project. Information supplied by Chrome's Paint Timing API are included in the dataset as they are important in terms of user experience. The two metrics: first paint (FP) and first contentful paint (FCP) mark the points, immediately after navigation, when the browser renders pixels to the screen. The primary difference between them is that FP marks the point when the browser starts to render the page, whereas FCP is the point when the browser renders the first bit of content from the DOM and is the first time users can start consuming page content. This query indicates that 12.3% of page loads achieved FP within 1000-1200 milliseconds (1 - 2 seconds) when loading “http://example.com” on a “mobile” device over a ”4G”-like connection.
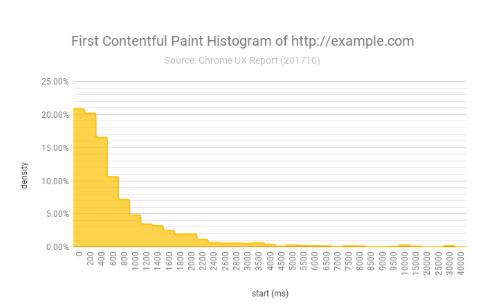
A histogram, like the one below for FCP, makes it easier to get an impression of app performance and user experience: Armed with the information they can obtain from Chrome User Experience report, web developers will be able to gauge how their own websites and apps measure up. Is this something devs will want to do? Or is this a Google too far?
More InformationIntroducing the Chrome User Experience Report Chrome User Experience Report - Developer Documentation. Related ArticlesChrome 61 Ready To Introduce New Features Chrome Introduces Scroll Anchoring
To be informed about new articles on I Programmer, sign up for our weekly newsletter, subscribe to the RSS feed and follow us on Twitter, Facebook or Linkedin.
Comments
or email your comment to: comments@i-programmer.info |
|||
| Last Updated ( Wednesday, 25 October 2017 ) |


