| Twitter Anomaly Detection Open Sourced |
| Written by Kay Ewbank | |||
| Wednesday, 04 February 2015 | |||
|
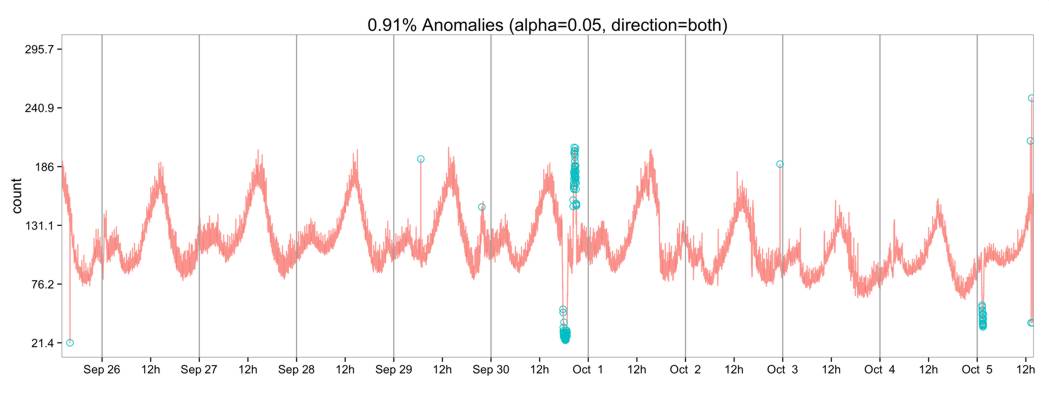
The package, which is now on GitHub, is written in R and automatically detects anomalies such as spikes in data, which happen on Twitter when a major news item breaks, or there's a major sporting event. The spikes can also be caused when bots or spammers are active, and the package can be used to find such bots or spam, as well as detect anomalies in system metrics after a new software release. The announcement of the release of the open source code on the Twitter Engineering Blog says that Twitter is open-sourcing AnomalyDetection because: “we’d like the public community to evolve the package and learn from it as we have”. Twitter also recently open-sourced BreakoutDetection, a complementary R package for automatic detection of one or more breakouts in time series. While anomalies are point-in-time anomalous data points, breakouts are characterized by a ramp up from one steady state to another.
The blog post says that anomalies at Twitter happen globally and locally with distinct seasonal patterns in most of the time series monitored in production. Local anomalies, or anomalies which occur inside seasonal patterns, are masked and thus are much more difficult to detect in a robust fashion. Anomalies can also be positive or negative, such as a point-in-time increase in number of Tweets during the Super Bowl. Robust detection of positive anomalies serves a key role in efficient capacity planning, while detection of negative anomalies helps discover potential hardware and data collection issues. The primary algorithm of the package is called Seasonal Hybrid ESD (S-H-ESD), and it builds on a more general test for detecting anomalies. S-H-ESD can be used to detect both global and local anomalies, by combining time series decomposition and robust statistical metrics. Where the analysis is looking at long time series, the algorithm also employs piecewise approximation. The package can also be used to detect anomalies in a vector of numerical values. You can specify the direction of anomalies, the window of interest (such as last day, last hour) and enable or disable piecewise approximation.
More InformationIntroducing practical and robust anomaly detection in a time series Related ArticlesFacebook Shares Deep Learning Tools Twitter Can Identify Heart Disease Twitter Indexes Every Single Tweet Ever
To be informed about new articles on I Programmer, install the I Programmer Toolbar, subscribe to the RSS feed, follow us on, Twitter, Facebook, Google+ or Linkedin, or sign up for our weekly newsletter.
Comments
or email your comment to: comments@i-programmer.info |
|||
| Last Updated ( Wednesday, 04 February 2015 ) |


