| D3.js in Action 2nd Ed (Manning) |
| Written by Editor | |||
| Tuesday, 20 February 2018 | |||
|
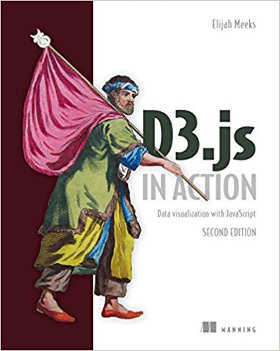
Subtitled "Data visualization with JavaScript", this guide to the D3 JavaScript library that shows how the API can be used for data visualization over HTML, CSS, and SVG has been completely updated. Author Elijah Meeks shows how to start with a structure, dataset, or algorithm; mix in D3; then programmatically generate static, animated, or interactive images that scale to any screen or browser. <ASIN:1617294489> It has many real-world examples, including force and network diagrams, workflow illustrations, geospatial constructions, and more. Author: Elijah Meeks
In his review of the original edition, D3.js in Action, Ian Elliot awarded a rating of 4.5 out of 5 and concluded: A good guide book in the style of a holiday guide book that has lots of things you need to see. As long as you are happy about JavaScript, HTML and CSS then this is a good way to discover D3.js. Ian Stirk gave a rating of 4.5 to D3.js By Example (Packt Publishing) saying: If you want to learn data visualization using the D3 framework, I can heartily recommend this instructive example-led book. For other recommendations of Data Science books see Reading Your Way Into Big Data in our Programmer's Bookshelf section. For more Book Watch just click. Book Watch is I Programmer's listing of new books and is compiled using publishers' publicity material. It is not to be read as a review where we provide an independent assessment. Some, but by no means all, of the books in Book Watch are eventually reviewed. To have new titles included in Book Watch contact BookWatch@i-programmer.info Follow @bookwatchiprog on Twitter or subscribe to I Programmer's Books RSS feed for each day's new addition to Book Watch and for new reviews.
|

