| Xamarin Platform Previews |
| Written by Kay Ewbank | |||
| Friday, 10 October 2014 | |||
|
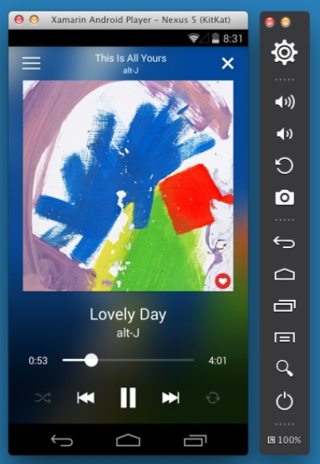
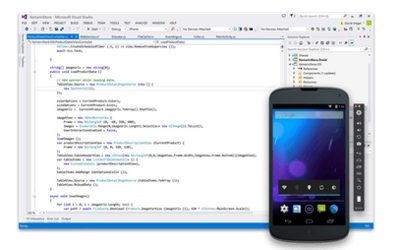
Several new features for the Xamarin platform, including an improved Android emulator and a real time monitoring system, have been introduced at Xamarin Evolve 2014 Hot on the heels of its test cloud, Xamarin has announced previews for four new Xamarin platform features. The first and possibly most useful preview is a better Android emulator to replace what Miguel de Icaza, describes as “the outdated, slow and clunky experience provided by the Android emulator.” The new Xamarin Android Player runs with hardware-virtualization on Windows or Mac and de Icaza says it will give your apps the shortest startup time and best possible performance through hardware-virtualization and hardware-accelerated graphics.
The Android Player is built using Xamarin.Mac on OSX and WPF on Windows, and has native user interfaces that have been customized for each platform following the idioms of Mac and Windows respectively.
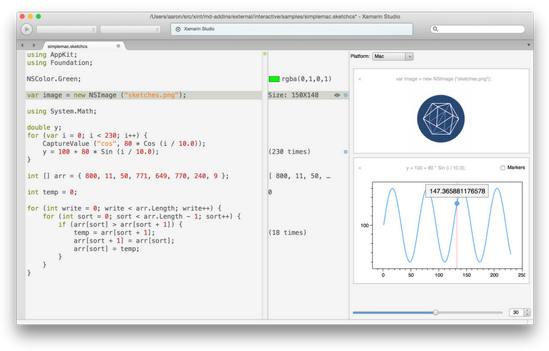
The emulator lets you simulate battery state condition and GPS location, and integrates directly into ADB (Android Debug Bridge), so your existing Android tools should work directly with the Xamarin Android emulator. Installing Android APKs is a matter of just dragging and dropping them into the Xamarin Android Player. The preview ships with Android KitKat 4.4.2, API Level 19 and a single form factor, and is free for current Xamarin subscribers. De Icaza says that by the time the emulator is launched, Xamarin will be distributing Android images for all the major API levels and form factors “as well as a few nice surprises”. The next preview is a tool called Sketches that is designed to make C# and F# more accessible. The utility acts as a C# or F# shell. It lets you watch code running, viewing both the intermediate results for the code and the effect it is having on the user interface. The code analysis lets you do things such as run a loop, and see the value of variables within the loop as a graph so you can view how values change. The idea is you might use Sketches to learn new APIs, prototype ideas, and modify designs iteratively.
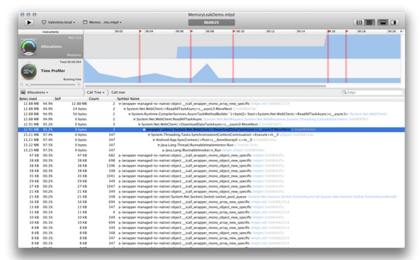
The current version of Sketches is available for iOS, Android, and Mac as a preview in the Xamarin Studio Beta Channel, and will be available for Visual Studio for Android, iOS and Windows. The third feature to be released in beta is a diagnostics tool called Profiler, comes in two native versions for Mac and Windows. This collects data on the performance of your C# app. You can use it to find memory leaks and identify performance bottlenecks.
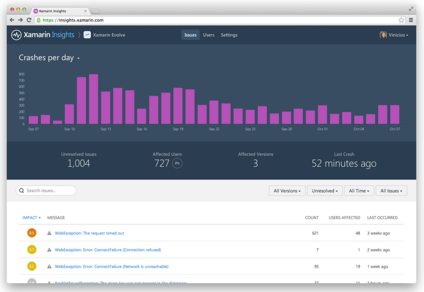
Yet another beta tool from Xamarin is Insights. This is a real-time monitoring system that lets you identify, report, and track problems with your apps. You add the tool to your app by adding a line of code, and Insights will gather and report any uncaught native or managed exceptions. You can track past and active sessions, including information of details such as the operating system and screen resolution.
Alongside the crash reporting, Insights lets you track any event within your app with a single method call. Insights can be integrated with services such as GitHub, HipChat, Visual Studio Online, and Campfire. It is available to Xamarin subscribers at no additional charge as a preview.
More InformationXamarin Android Player Preview Related ArticlesMicrosoft And Xamarin Collaborate To Bring Native iOS and Android To Visual Studio Is Microsoft Going To Revitalise .NET With Xamarin Acquisition?
To be informed about new articles on I Programmer, install the I Programmer Toolbar, subscribe to the RSS feed, follow us on, Twitter, Facebook, Google+ or Linkedin, or sign up for our weekly newsletter.
Comments
or email your comment to: comments@i-programmer.info |
|||
| Last Updated ( Friday, 10 October 2014 ) |
