| TraceGL - An Oscilloscope For Code |
| Written by Ian Elliot | |||
| Monday, 29 April 2013 | |||
|
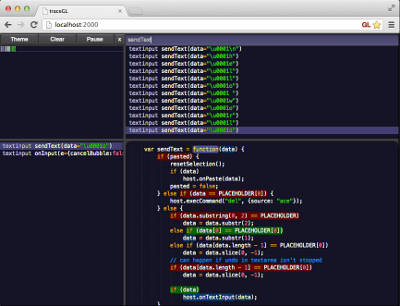
With traceGL you can see all JavaScript codeflow, in a high performance webGL visualizer. It's like an oscilloscope, for code - and if you don't know what an oscilloscope is, you want one, you really do. traceGL is referred to as a trace debugger. The sort of debugger that you have supplied within a typical browser is a breakpoint debugger. You set breakpoints and the code runs until it hits the breakpoint where you can examine variables and find out if the actual state matches your predicted state. You can generally single step from a breakpoint to discover what happens next, but generally you go from one breakpoint to another. A trace debugger attempts to show you what the execution path is and what the general state of things is as the program executes. traceGL works by automatically instrumenting your code, i.e. adding lines of code that report to the traceGL client. You can use it to trace either Node.js programs or programs running in a browser, including JavaScript served by Rails or Java backends. The key factor is that traceGL has to serve the JavaScript so that it can instrument it and to do this it has a proxy or static server built in.
To run traceGL all you have to do is install Node.js and start running the traceGL client. The data sent to the client is processed and presented in a multi-windowed display. The display is created using WebGL and shows an overview of the trace, a zoomed in view. a stack trace and the code. Hovering over any variable in the code shows its value. The reason that WebGL is used is to minimize the load on the JavaScript VM while running traceGL in the browser. Take a look at the video demo to see if you think that this approach to debugging is for you:
traceGL costs $14.99 and you can buy it using Bitcoin or credit card. More InformationRelated ArticlesCode Digger Finds The Values That Break Your Code Debugging and the Experimental Method Chrome Native Debugger For Visual Studio Does Your JavaScript Leak? Introducing Google Leak Finder Debug the easy way with Canvas
To be informed about new articles on I Programmer, install the I Programmer Toolbar, subscribe to the RSS feed, follow us on, Twitter, Facebook, Google+ or Linkedin, or sign up for our weekly newsletter.
Comments
or email your comment to: comments@i-programmer.info

|
|||
| Last Updated ( Monday, 29 April 2013 ) |