| New SharePoint Web Parts |
| Written by David Conrad | |||
| Friday, 21 October 2011 | |||
|
Infragistics' latest toolset is a set of Web Parts for creating visualizations, including maps, charts, timeline and gauges, from SharePoint data. NetAdvantage for SharePoint 2011 is a set of SharePoint Web Parts that enable you to to build code-free dashboards to visualize Key Performance Indicators (KPIs) and actionable metrics.
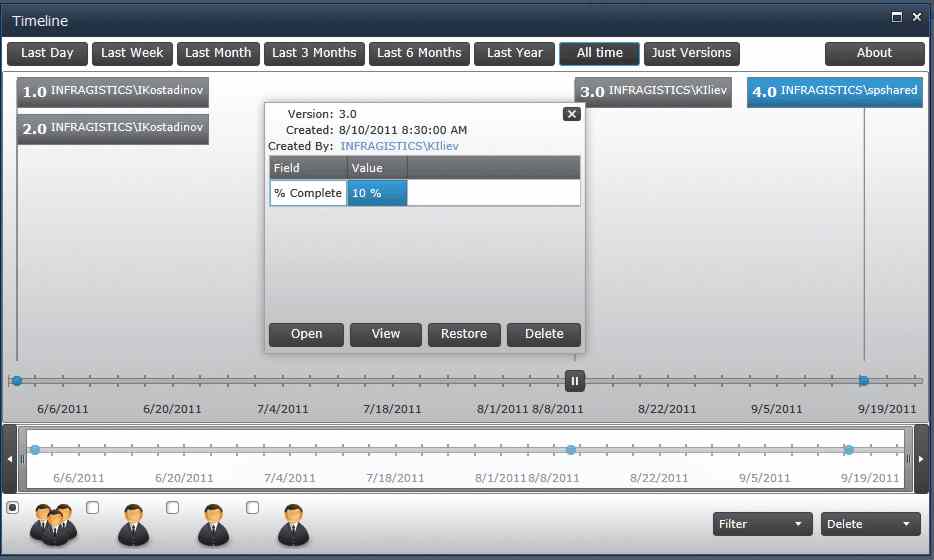
This XAML data visualization-based Web Parts solution lets you turn SharePoint data into an interactive experience. Its Version Timeline, for example, translates document version history in a Document Library into a visual horizontal timeline for easy identification of the document review process.
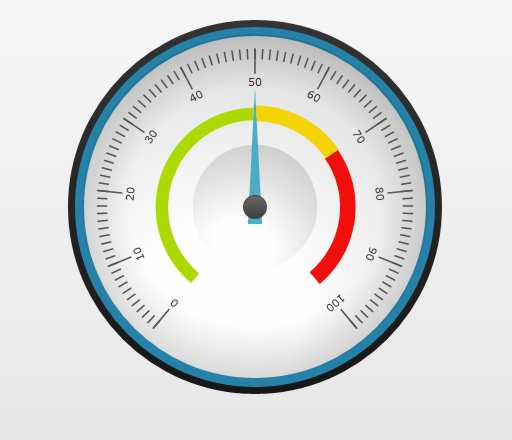
With its Content Rotator Web Part, users can point to content from more than one library, create a video ‘playlist’ with animations like “fade” or “slide-left” and playback controls for end-user navigation. The Map Web Part can be used to display data at multiple levels such as at a street, city, state, country or any geographic coordinate while Data Chart and Gauge Web Parts can be used to present key performance indicators and business intelligence.
Subscribers to NetAdvantage Ultimate will automatically receive a developer-only license to set and test Web Parts. Web server deployment requires a paid license per server. More information:NetAdvantage for SharePoint 2011
To be informed about new articles on I Programmer, subscribe to the RSS feed, follow us on Twitter or Facebook or sign up for our weekly newsletter.
|
|||
| Last Updated ( Friday, 21 October 2011 ) |


