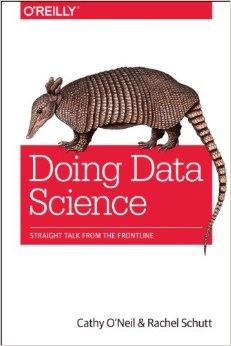
| Doing Data Science |
Author: Rachel Schutt and Cathy O’Neil ISBN: 9781449358655 Audience: People who want to learn more about big data Reviewer: Kay Ewbank There’s a lot of hype about big data talked by people who are just using the latest buzz words, but this book is written by people who are actually working with real live big data.
The book is based on Columbia University’s Introduction to Data Science class, and is actually a collection of lectures, each one occupying a chapter, on different aspects of data science. The chapters have extensive contributions from data scientists from companies such as Google, Microsoft, eBay, Yahoo, Kaggle, and Hunch, talking about how they apply data science analysis techniques in their work. The book opens with a look at just what data science means, getting past the hype. The authors point out that there are a lot of people in academia and industry who’ve been working on large data sets for decades, and that despite the hype, big data DID exist before Google. They give a good overview of the current landscape and what people are really doing in data science.
If Chapter one is a scene-setting overview, the next chapter gives more of a clue of the subject matter of the rest of the book. It covers statistical inference, exploratory data analysis, and the data science process, and it ends with a set of exercises for you to complete using R, a thought experiment on how you might simulate chaos, and an exercise where you’re asked to come up with a data strategy for a real estate company called RealDirect (alongside a case study of how they operate). Algorithms are the topic of the next chapter; in particular machine learning algorithms, linear regressions, k-nearest neighbors, and k-means, and there are exercises on using those algorithms to work on a housing dataset. These are good representations of what happens throughout the book. In this chapter, the exercises are a mix of the ‘predict the neighborhood using a k-NN classifier’ type; you’re also expected to report and visualize your findings, and ‘describe any decisions that could be made or actions that could be taken from this analysis’. You can probably tell that this is a book that aims not just to lay out the techniques and ideas, but to teach you how to use the statistical methods to be able to analyze data sets. You are shown sample code for the exercises, but this is definitely a book that aims to teach you how to think like a data scientist. The next chapter, on spam filters, naïve Bayes and data wrangling, is written by Jake Hofman, who works at Microsoft Research. He opens with a screenshot of an email inbox, asks you which emails look like spam, then asks how you might write code to automate the spam filter that your brain represented. There’s a nice discussion of why you couldn’t use the methods learnt so far for this task, followed by an introduction to Bayes, Laplace smoothing, sample code in bash, and an explanation of how to get and use web scraping APIs to retrieve data from the web.
Logistic regression and evaluation is next on the agenda, with contributions from Brian Dalessandro of Media6Degrees, an online advertising company. The level of stats is going up by this stage, with many of the pages being at least half filled with equations. However, even if you aren’t a statistician, the descriptions are still easy to follow. A chapter on time stamps and financial modeling comes next, with input from Kyle Teague of GetGlue, a company that does content discovery in movies and TV to provide personalized recommendations. The material on financial modeling covers aspects such as volatility measurements and feedback loops. Researchers from Kaggle (William Cukierski) and Google (David Huffaker) have contributed to the chapter on extracting meaning from data. Cukierski looks at feature extraction and feature selection – how to find the usable data, and how to select subsets of the data as the variables for your data models. Huffaker considers how you can use a mixture of qualitative and quantitative research, and work with big and little data, to arrive at meaningful answers. Recommendation Engines, and how to build user-facing products at scale are tackled next, with input from Matt Gattis of Hunch.com. This started life as a website that gave recommendations, and was acquired by eBay. The chapter looks at machine learning classification, the dimensionality problem, singular value decomposition, and principal component analysis. Half way through the chapter there’s a boxout telling you ‘time to brush up on your linear algebra if you haven’t already’, and warning that the rest of the chapter won’t make much sense if you don’t. You have to admire a book that lays it on the line like that. Data visualization and fraud detection are covered next. The data visualizations used as examples are far from bar charts; one shows the amount of energy used by a city by projecting a color onto a proportion of the steam cloud of a power plant. Another shows different blocks of a city in different colors depending on how much money is being spent to keep people from there in prison. The range of projects was fascinating. The second half of the chapter looked at risk, with input from Ian Wong from Square, a commerce company that aims to make transactions easy. The company uses machine learning with visualization to identify fraudsters, and the chapter describes performance estimation and how it can go wrong, before going on to give some excellent tips for model building. Social networks and data journalism , and how to use the data social networks generate is the next topic, using the idea that constructing stories that can be told from social network data is a form of data journalism. Causality, working out what caused someone to do something, gets a chapter to itself, looking at the difference between correlation and causality. There’s a write-up of some interesting analysis of what to say (and not say) when online dating (don’t say someone’s sexy or beautiful on your initial email; cool, fascinating and awesome are better). The authors then go on to look at randomized clinical trials, A/B tests, and observational studies. Epidemiology and the analysis of medical data follows in the next chapter, with discussions of how statistics is being used (and sometimes used badly) to work on medical trials. Data competitions, data leakage and model evaluation are next on the agenda, with a contribution from Claudia Perlich of Media 6 Degrees, and who has won several data mining competitions. The idea of data leakage refers to data that helps you predict something, and the problems this can cause because it then skews your data model. The authors then move on to look at how to avoid this when evaluating which data model to use. The contributors to the chapter on data engineering: MapReduce, Pregel and Hadoop, both started out in the Google+ data team. David Cranshaw and Josh Wills discuss the problem of ever expanding big data, how it eventually breaks whatever size of computer system (or systems) you’re using, and how MapReduce attempts to overcome those problems . The book closes with a chapter from the students who took the original course, and a final wrapping up chapter. If you’re at all interested in big data, you’ll learn a lot just from the case studies and discussions by the big data practitioners who’ve contributed. If you know some stats and R, you can get another big chunk of usefulness by looking at the exercises, examples and code, but even if you glaze over a bit in those parts, it’s still a fascinating read.
|
|||
| Last Updated ( Wednesday, 08 March 2017 ) |


