| YouTrack 6 Adds Live Dashboard |
| Written by Alex Armstrong | |||
| Tuesday, 11 November 2014 | |||
|
JetBrains has announced the availability of a major new release of its comprehensive IDE-style issue tracking and project management tool.
Over successive releases YouTrack issue has matured into a full-featured agile project management tool with facilities for planning releases, sprints and iterations, and tracking daily tasks, bugs and customer requests. It lets development teams visualize project activities, analyze performance and monitor progress. It is available in two versions - Stand-Alone that runs on your own server or InCloud hosted by JetBrains. In both cases it is free for up to 10 users. If you haven't come across it before, this overview video introduces YouTrack in less than 5 minutes:
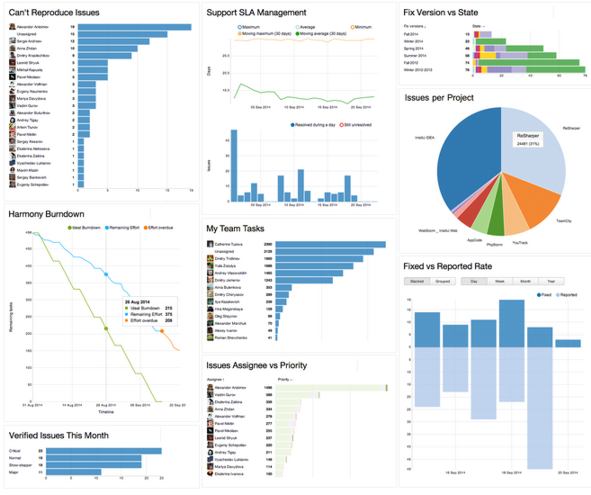
The latest release adds 17 reports which come in four different types: Issue Distribution, Timeline Reports, Time Management, and State Transition. Each report provides a unique slice of data related to team projects, tasks and issues and represents them as charts, graphs and matrices as appropriate.
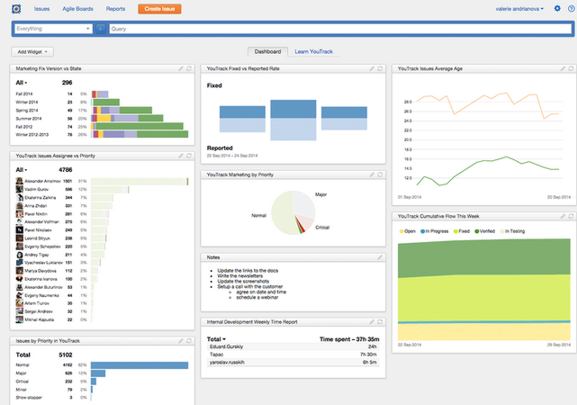
YouTrack 6 introduces a live Dashboard allowing you to pick any widgets such as reports, top issues, quick notes and so on, and drag them to a personalized Dashboard to organize and monitor everything all in one place, in real time.
Other new features include:
All of these are outlined by Dmitri Nesteruk in this video:
All the new features are available in both the InCloud (hosted) and More InformationRelated ArticlesHosted Bug Tracker from JetBrains
To be informed about new articles on I Programmer, install the I Programmer Toolbar, subscribe to the RSS feed, follow us on, Twitter, Facebook, Google+ or Linkedin, or sign up for our weekly newsletter.
Comments
or email your comment to: comments@i-programmer.info |
|||
| Last Updated ( Tuesday, 11 November 2014 ) |


