| JetBrain's Qodana - More Than Just A Linter |
| Written by Nikos Vaggalis | |||
| Thursday, 21 October 2021 | |||
|
Qodana is a new offering from JetBrains. It detects and flags programming errors, but it's much more than that - it's a complete Code Quality Platform.
While Qodana's job is to identify and suggests fixes for bugs, security vulnerabilities, duplications, imperfections, anomalous code, probable bugs, dead code, etc, it is also a complete Code Quality Platform with the aim of improving the overall code structure of a project by applying best coding practices. Of course, at its core Qodana is a collection of linters which provide project analysis locally or in any CI with every linter providing two types of output:
In particular note that Qodana can "provide project analysis locally or in any CI" .As such developers can have the same universal set of inspections across their JetBrains IDEs as well as their CI pipeline, including JetBrains Space, TeamCity, GitHub Actions, Jenkins, and GitLab CI. As already said, it can also be used locally and run anywhere by a Docker image. The following Docker images are provided for the Qodana linters:
There are two experimental linters:
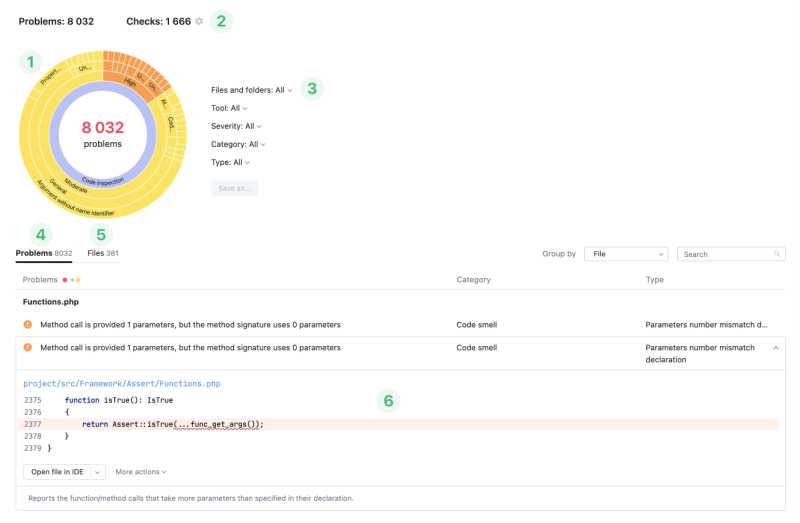
There's also a UI which can be part of the CI user interface in cases where the CI supports the UI extension. If it doesn't, you can spin up the Qodana UI on your own and on the browser which will always be available on http://localhost:8000. The UI comes with HTML reports comprising of the following blocks:
Sunburst diagram Checks total and Profile settings Filter set Problem explorer File explorer Code fragment view The kind of statistics that the reports track, or the files that they inspect, can be tweaked from the Profile settings window. So while the default profile contains the most common inspections, you are free to fine-tune it to your experience. Alternatively you can configure the profile via the qodana.yaml configuration file. Qodana already supports Java, and Kotlin projects, and will eventually support all languages and technologies covered by JetBrain's IDEs. It has already released the Early-Access Program for PHP and Python. To take it for a spin before you install anything, there's the Qodana Playground, a sandbox environment running in the JetBrains cloud CI, TeamCity. There you see the tool in action by trying various options yourself. To open the sandbox playground, use the link https://qodana.beta.teamcity.com/ and select the “login as guest” option You can use the tabs to see what problems it found, browse the list of inspections that it ran, and try out the different options for yourself. JetBrains Qodana is now available under an Early Access Program (EAP). During the EAP users will have full access to Qodana Docker, Qodana TeamCity Plugin, and Qodana GitHub Application free of charge Community versions of Qodana for JVM will be available for free, and in the future, JetBrains aims to release Qodana for JVM Enterprise that will introduce features like automated security and license compliance checks and priority support. Existing customers of JetBrains’s IDEs will receive complimentary licenses for Qodana.
More InformationRelated ArticlesGitHub Introduces Super Linter The State Of Secure Software Development - Three OpenSSF Courses Semgrep - More Than Just a Glorified Grep Visual Studio Code - Now With Added Extensions Never Mind The Code Quality ... To be informed about new articles on I Programmer, sign up for our weekly newsletter, subscribe to the RSS feed and follow us on Twitter, Facebook or Linkedin. 
Comments
or email your comment to: comments@i-programmer.info |
|||
| Last Updated ( Thursday, 21 October 2021 ) |