| StatCounter's Animated Map Shows Shifting Browser Landscape |
| Written by Janet Swift |
| Monday, 09 July 2012 |
|
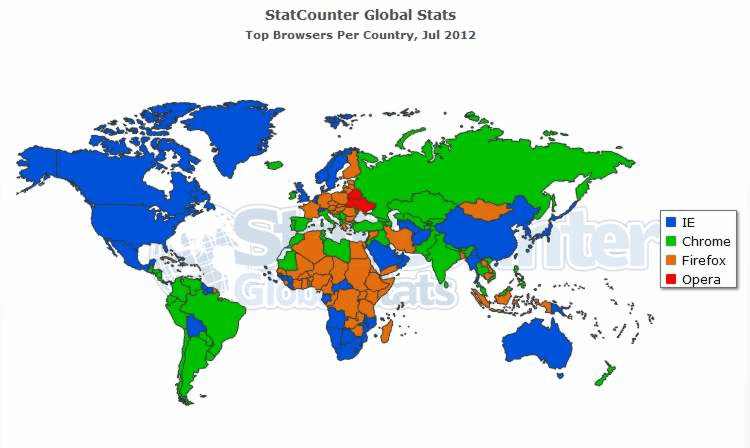
If you look back four years Internet Explorer was the dominant browser almost everywhere in the world. A couple of months back Chrome overtook IE in worldwide terms, but IE still rules over a lot of territory. In Statcounter's map of top browsers by country for July 2012, IE is blue, Chrome is green, Firefox is russet and Opera is red.
(Click in map to enlarge)
We often report trends using StatCounter's charts but now the web analytics company has done something even more informative with its statistics it collects - it has produced an animation combining maps and charts to show how the global landscape for the major browsers has changed over the period 2008 to 2012. In viewing the animation (starting at 0.48) that takes you from July 2008 to June 2012 in less than a minute you need to look not only at the four colors but also their four shades - the darkest means over 60% share, the lightest less than 30% share.
What I found fascinating is how from early 2009 when it first switches away for IE Russia changes it color with amazing frequency - first to Opera, then back briefly to IE, then Opera and Firefox fight it out in 2010 and Chrome makes its first appearance there in early 2012, with IE making a short comeback. Meanwhile some part of the world - notably Australia, China, UK and USA stay firmly blue - although the shade fluctuates more the nearer we approach the present. Looking for where in the world users have stayed faithful to Firefox, Finland, Germany and countries in between, and Indonesia stand out. An if you want to know which is the country most loyal to Opera it appears to be Belarus, which has embraced it since September 2008.
More InformationRelated ArticlesChrome Overtakes IE In Global Stats A Change of Direction in the Race for Browser Market Share? Chrome 15 - World's Most Popular Browser Internet Explorer has less than 50% of the market
To be informed about new articles on I Programmer, sign up for our weekly newsletter, subscribe to the RSS feed and follow us on Twitter, Facebook or Linkedin.
Comments
or email your comment to: comments@i-programmer.info |
| Last Updated ( Wednesday, 19 July 2023 ) |


