| Google Analytics adds new view |
| Monday, 18 October 2010 | |||
|
Do you want to know which links on your site visitors click. Now you can with a new feature that gives instant visual insights into click behavior and helps optimise your page layout.
Google has released a beta version of a new feature: In-Page Analytics which lets you see your Google Analytics data superimposed on your website as you browse and has been designed to answer questions including:
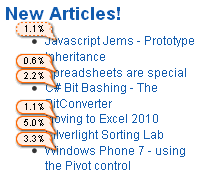
The most obvious indicators are 'Bubbles' which display the percentage of clicks that a link generated, making it easier to see the most popular parts of a page. A solid line border around the bubble indicates that one link leads to the destination page, whereas a dotted-line border means that there is more than one link leading to the same page.
Conventional wisdom suggests that clickable links should be at the top of the page and In-Page Analytics gives a clear message as to the percentage of links below the viewed area.

A video on Google's blog explains how it works and some of its more advanced features. This seems a nice addition to Google Analytics that should help all website owners.
Further ReadingTeach Yourself Google Analytics (book review)
|
|||
| Last Updated ( Monday, 18 October 2010 ) |


