| Discover Chrome DevTools With A Free Course |
| Written by Sue Gee | |||
| Tuesday, 26 March 2013 | |||
|
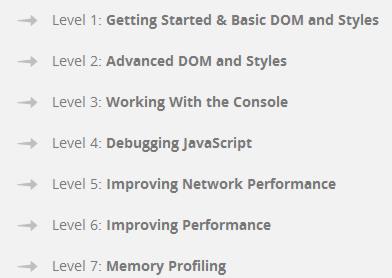
Google has teamed with Code School to produce a training course that covers the developer tools available in Chrome for developing and debugging web apps. Chrome's Developer Tools are based on the WebKit inspector and give developers deep access into the internals of the browser and their web applications. As is often the case with open source tools, there's a lot to learn in order to use them to their full potential, hence the need for some training materials. As Paul Irish explains on the Chromium blog: Even regular users of the Chrome DevTools may be surprised to find some lesser-known features from this course that can really boost productivity. You'll learn a debugging workflow to go from an uncaught exception to a live fix without ever refreshing your app. In addition, the course will share time-saving tricks to improve your efficiency while debugging CSS, improving reflow issues, and interpreting your network and JavaScript bottlenecks. You'll also uncover the DOM bottlenecks that are blocking you from delivering a slick 60 FPS experience. The Discover DevTools course. is an Elective option in the Code School catalog and consists of these seven chapters:
In each you start with an overview video and then complete a series of challenges, for which you receive immediate feedback and also earn points. There are badges for each successfully completed chapter. In all there are over 75 challenges Find out more about the course in this overview video:
The course is free to anyone who has enrolled in Code School and will require fifteen or more hours to complete.
More InformationRelated Articles
To be informed about new articles on I Programmer, install the I Programmer Toolbar, subscribe to the RSS feed, follow us on, Twitter, Facebook, Google+ or Linkedin, or sign up for our weekly newsletter.
Comments
or email your comment to: comments@i-programmer.info
|
|||
| Last Updated ( Tuesday, 26 March 2013 ) |


