| Microsoft Open Sources SandDance |
| Written by Kay Ewbank | |||
| Tuesday, 22 October 2019 | |||
|
Microsoft has open sourced a rewritten version of SandDance, its data visualization tool. The rewritten version has been reworked as an embeddable component that can be used in native JavaScript or React apps. Unlike the previous closed version, this new version of SandDance has been rebuilt with the goal of being modular, extensible, and embeddable into your custom applications. SandDance is created with open source libraries, using Vega for chart layout and Deck.gl for WebGL rendering.
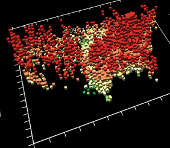
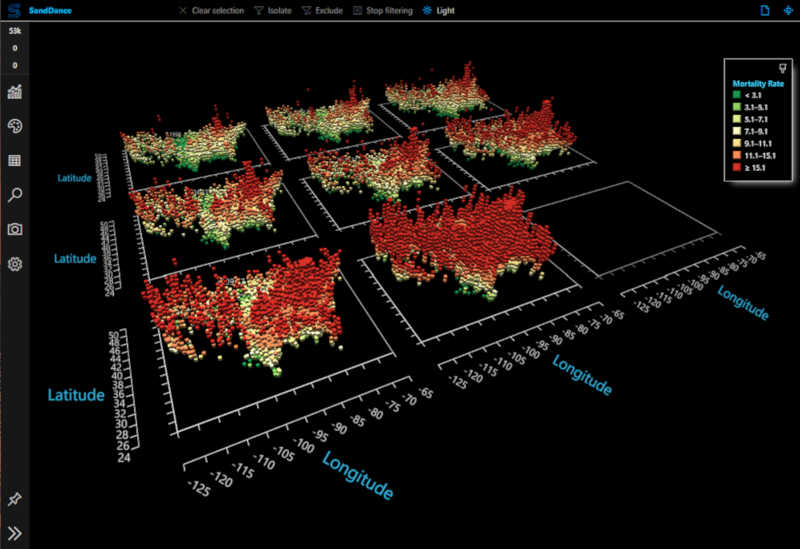
SandDance was first released in two versions in 2016, as a standalone Web-based tool and a custom Power BI visual. to provide a way of exploring and presenting data using unit visualizations. This provides an alternative to aggregating data and showing the aggregations in bar charts. Instead, SandDance shows every single row of a dataset as a mark that can be colored and organized into different areas on the screen. Moving particles represent data, and they can “dance” from screen to screen as you select and filter data and show it the way you want to, through 3D scatterplot, maps, charts, and histograms. SandDance provides 2D and 3D visualizations, bar charts, scatter plots, stacked charts, density plots, as well as interactive filtering and faceting of the data.
The new release consists of a number of components; the core SandDance visualization canvas; an equivalent for use in React based applications; and an extended version with a UI. SandDance is also available as an extension to Visual Studio Code and Azure Data Studio, as well as being re-released as a Power BI Custom Visual. SandDance was created by the Microsoft Research VIDA Group which specializes in projects that use novel ways to visualize and analyze data. Other projects from VIDA include MorphCharts, whcih aims to show complex data in a web browser using both mixed and plain reality "to immerse a user in a story and communicate insights"; and HoloTable, which used view-dependent rendering to simulate a 3D experience for visualizing data as a "holographic" ("above-screen") or "volumetric" ("below-screen") display. Head-tracking using a Kinect sensor provided depth-cues via parallax.
More InformationRelated ArticlesTo be informed about new articles on I Programmer, sign up for our weekly newsletter, subscribe to the RSS feed and follow us on Twitter, Facebook or Linkedin. 
Comments
or email your comment to: comments@i-programmer.info |
|||
| Last Updated ( Friday, 01 November 2019 ) |