| Amazon CloudWatch |
| Written by Kay Ewbank | |||
| Tuesday, 15 July 2014 | |||
|
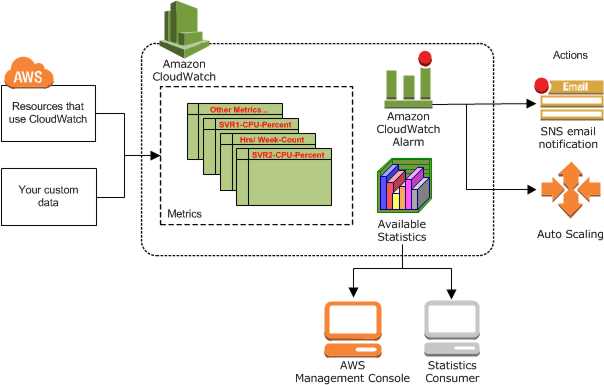
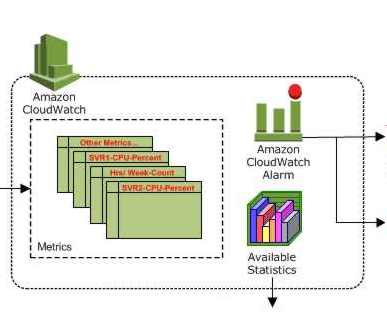
A new service that lets you monitor and troubleshoot systems and applications from Amazon EC2 instances has been released by Amazon. In terms of its architecture, Amazon CloudWatch is basically a metrics repository. An AWS product, such as Amazon EC2 puts metrics into the repository, and you retrieve statistics based on those metrics. If you put your own custom metrics into the repository, you can retrieve those statistics as well.
Amazon CloudWatch lets you monitor system, application, and custom log files. To use the service you send your log files to CloudWatch Logs and monitor the logs in near real-time for specific phrases, patterns or values. This means you could work out what level of errors on your system logs should trigger an alarm, set up the alarm, and CloudWatch will keep track and warn you if that many errors occur. You can then view the original log data to see the source of the problem. You can also use the alarms to detect and shut down Amazon EC2 instances that are unused or underutilized. In a post about using the new service on the Amazon Application Management blog, Chris Barclay says that you could, for example, "monitor application logs for specific literal terms (such as "NullReferenceException") or count the number of occurrences of a literal term at a particular position in log data (such as "404" status codes in an Apache access log). When the term you are searching for is found, CloudWatch Logs reports the data to an Amazon CloudWatch metric that you specify. You can then retrieve the associated log data from CloudWatch Logs if, for example, the count of "NullReferenceExceptions" exceeds its normal range." In addition to the alarms, CloudWatch comes with a set of graphs and statistics in a dashboard that lets you view all your monitored AWS resources, and all your alarms. You can set it up to also show application metrics that you provide. CloudWatch Logs includes an installable agent for Ubuntu, Amazon Linux, and Windows that you can use to send your logs to CloudWatch. The CloudWatch Logs Agent can be installed using CloudFormation, Chef, EC2 User Data or through direct command-line setup. The AWS free usage tier includes 10 Metrics, 10 Alarms, and 1,000,000 API requests with Amazon CloudWatch.
More InformationRelated ArticlesAWS Elastic Beanstalk For Node.js Amazon Cognito - A Sync Solution
To be informed about new articles on I Programmer, install the I Programmer Toolbar, subscribe to the RSS feed, follow us on, Twitter, Facebook, Google+ or Linkedin, or sign up for our weekly newsletter.
Comments
or email your comment to: comments@i-programmer.info |
|||
| Last Updated ( Tuesday, 15 July 2014 ) |


