| Silverlight Sorting Lab |
| Written by Ian Elliot | |||||||
| Tuesday, 12 October 2010 | |||||||
Page 1 of 6 A sorting lab implemented in Silverlight may not sound interesting but when you see it in action and read about the difficulties of getting the threading right you have to think again. 
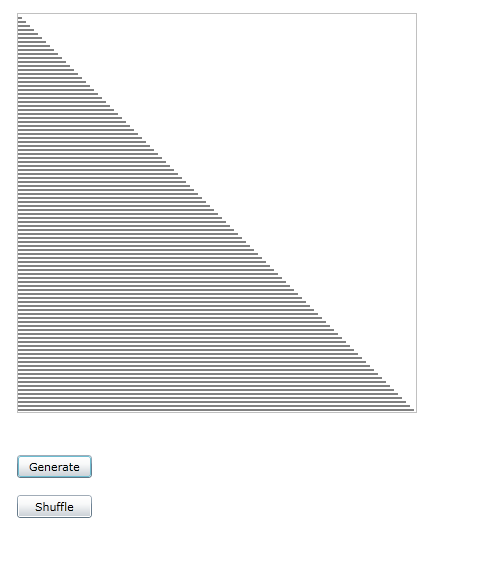
There are lots of different ways of sorting a list of items into order and there are also lots of applications designed to show how sorting works. If you would like to try this project out visit: SilverSort. This project is all about implementing a sorting demo in Silverlight but it is also about how to best implement a computationally intensive task that also needs to implement some code-generated animations. It turns out to be surprisingly difficult. As part of this project you will find out how to use the BackgroundWorker class, BeginInvoke and the DispatcherSynchronisationContext class. Perhaps more important you will also understand what a difficult issue multi-threading the UI actually is. The basic idea is to draw a bar chart of the data and animate it while the sorting is proceeding. This sounds easy but there are a number of different sorting methods to illustrate and having to add animation to each one would result in some very complex and boring code. In any sorting method there are two important operations, compare and swap. Some sorting methods use other operations but the majority can be written quite naturally in terms of compare and swap. This suggests that the animation can be achieved by simply providing and using a pair of functions that perform the operations and animate the chart. That is the basic strategy is to implement each sort using a standard swap routine that will not only move data but animate the live graphic of the current state of the data. We also have another big design decision to make - bitmap or vector graphics. An early version of this program used a WriteableBitmap to render a Line shape object to. However it soon became clear that a fully object oriented vector graphic approach was going to be easier, more natural and as efficient. The vector graphic version of the chart is the one presented in this article. The formOpen a new .Silverlight project and place a Canvas control and two buttons on it. The first button is intended to generate some integer data in ascending order. So change the button’s caption to “Generate” and its click event to: const int scale = 4; private void button1_Click( The basic idea here is to create an array of integers to be sorted, i.e. data, and an array of Line objects which are added to the Canvas. The Line objects are spaced so as to draw a simple graph of the data. The reason for keeping the array of Line objects rather than just building up the Canvas's collection is that later in the program we are going to want to move the Lines around as the data gets sorted. If you run the program and click on the Generate button then you will see the simple chart:
Notice that there is nothing we have to do to make the chart appear - Silverlight and WPF both use retained graphics which means you don't have to refresh the display. Also notice that this is fine all running on the UI thread. Indeed if you were to try to move the code to a worker thread most of it would have to be delegated back to the UI thread again because it all works with UI objects. Consider for a moment what would happen to the UI if this routine was working with1000s of lines? The answer it that the UI would come to a halt while the lines were generated. Also notice that the chart isn't actually drawn on the screen until the button's even handler terminates and the UI thread is free to deal with the redraw of the UI.
<ASIN:1430229799 > <ASIN:1430224258 > <ASIN:0470650923 > <ASIN:1847199844 > <ASIN:143022455X > |
|||||||
| Last Updated ( Monday, 30 October 2023 ) |