| IoT Anomaly Detection Using A Kalman Filter |
| Written by Dattaraj J Roa | |||
| Monday, 12 December 2016 | |||
|
Kalman filters are often regarded as advanced, but you can't afford not to know about them because they provide the best approach to tracking a system. If you know where a system should be in theory then you can detect when it isn't and this is the basis for Kalman filter anomaly detection. GE's Predix has a range of sophisticated statistical procedures - including a Kalman filter.
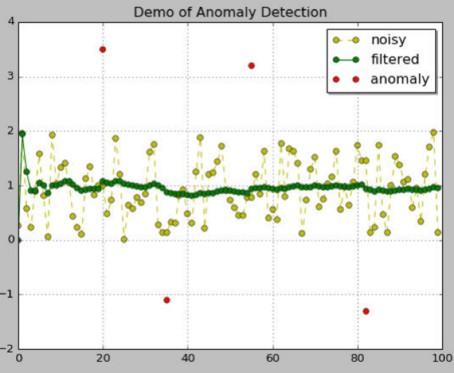
Predix is GE’s software platform for the Industrial Internet. Deployed on machines, onsite or in the cloud, Predix handles big data at an industrial scale, providing insights to improve asset performance management, ops and business. The following article explores how the Kalman Filter, when applied, can filter out noise and provide smooth data values for Predix users. Many industrial machines have begun using sensors located at various strategic points to gauge physical characteristics. Often, though, these sensor readings are frequently prone to noise because of environmental factors, device errors, electrical interferences, etc. The Kalman filter is a software-based method to filter out noise and provide smooth data values that can be used for further analysis. The filter, developed by Rudolf E. Kálmán, is a linear quadratic estimator that observes a series of measurements and uses this knowledge to estimate a probability distribution and predict future values. These estimates provided by the filter work by removing the noise and providing a more accurate representation of data. For example, the location readings (latitude, longitude) collected from a GPS sensor on a Locomotive typically has a lot of noise. The Kalman filter is frequently used to clean up this data and get a more accurate estimate of the train location over time. These corrected readings are then used for different network calculations and planning of routes to improve overall network throughput. Even a 1% improvement in network efficiency can lead to millions of dollars of savings for railroad customers. The chart below, titled “Demo of Anomaly Detection”, shows an example of data collected from a sensor that has a large variation (light green points). From looking at this data it is difficult to understand if the variation is due to sensor readings or noisy measurement. Kalman-filter, when applied, filter the data and gives a smooth curve as indicated by the dark-green line.
In the above diagram, there are now 2 datasets from a single input sensor data – raw data (light green) and filtered data (dark green). Using the 2 datasets we apply statistical inference to identify anomalies. Anomalies are deviations in the data due to the process being monitored and not due to noise in the measurements. This is what is detected by the Kalman Anomaly Detection Analytic as an extension of the Kalman-filter method. It uses the raw and filtered data to determine which points are actual anomalies. As seen on the chart, the red points, those that remain in the extremities even after filtering, are anomalies. The Kalman Anomaly detection Analytic works in the following manner:
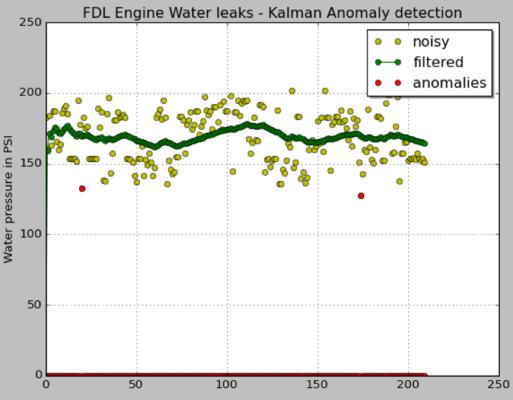
This method provides a quick way of checking if sensor data has anomalies using a simple input array. The algorithm uses a generic time scale, which uses the same scale for input data as it does for the output anomaly indicator values. For example, if we input data per second, the output values will be also per second. As a real world example, let’s take a GE AC4400 locomotive powered by a 16 cylinder FDL engine. This is a water-cooled engine and any loss in water pressure can cause overheating of the engine leading to field failure. See the plot below of a locomotive’s engine coolant water pressure data collected over time with steady operation. We see that it is very difficult to point out signatures of anomalies in this noisy data. Using the Kalman Anomaly Detection analytic, a statistical method is used to understand trend in data and identify anomalies that violate this trend. The anomalies found should be treated as signatures of possible engine failure and further investigated to understand if the failure is real.
(DISCLAIMER: Data used in chart is from a model and not real machine data) Register for a Predix account here plus check out the full list of algorithms available under the Analytics Catalog at Predix.io.
More InformationRelated ArticlesPredix - A Platform for the Industrial Internet Of Things
To be informed about new articles on I Programmer, sign up for our weekly newsletter, subscribe to the RSS feed and follow us on Twitter, Facebook or Linkedin.

Comments
or email your comment to: comments@i-programmer.info |
|||
| Last Updated ( Monday, 12 December 2016 ) |