| DotMemory Profiler for .NET |
| Written by Kay Ewbank |
| Wednesday, 30 April 2014 |
|
A memory profiler for .NET has been released by JetBrains, with tools to let you view memory usage data from multiple angles.
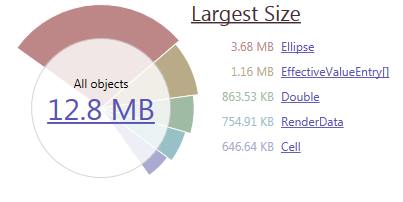
The utility, which adds to JetBrains existing line-up of tools for .NET developers, lets you use ten different criteria to see the way your memory is being used. Those criteria can be combined so you can view data in different contexts, and can drill-down, dice, slice or pivot the data to get a closer view. You can also jump to any data slice, and visualize the data using graphs.
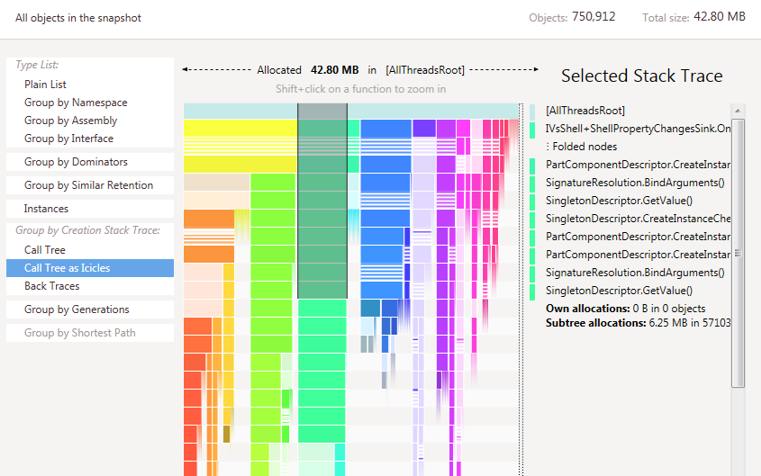
The software has automated inspection options that detect common types of memory leaks. If you need to carry out more analysis, there are a number of data views. You can group objects that are consuming the most memory and single out which subsystems are the heaviest users on the same view. Another option shows object key retention paths so you can work out what is holding the object in memory. An Icicles Chart lets you take in the entire call tree and navigate to the parts you need.
(click to enlarge)
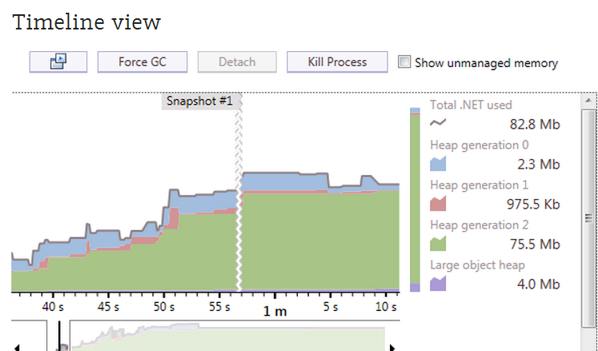
The package can also be used for memory traffic analysis to detect what is causing excessive garbage collection, and you can compare memory snapshots to visualize improvements or regressions in memory usage. The software lets you use remote profiling to detect memory issues if you have a problem in a production environment, and there’s a timeline view that captures real-time data. You can also use a profiling API t to invoke the profiler from exact code positions in your applications. Maarten Balliauw, JetBrain's Technical Evalgelist introduces the workflow of capturing and analyzing memory snapshots using dotMemory 4 with Conway's Game of Life being used as the sample process in this 5-minute video
dotMemory can be used with apps based on .NET framework 2.0 up to 4.5.1, including desktop applications, web applications and web services. There’s a free 10-day evaluation and personal and company licences are available.
More InformationRelated ArticlesJetBrains Updates .NET Development Tools ReSharper 8.0 For Visual Studio 2013
To be informed about new articles on I Programmer, install the I Programmer Toolbar, subscribe to the RSS feed, follow us on, Twitter, Facebook, Google+ or Linkedin, or sign up for our weekly newsletter.
Comments
or email your comment to: comments@i-programmer.info |
| Last Updated ( Wednesday, 30 April 2014 ) |


