| Visual Studio Code Now Supports Virtual Threads |
| Written by Nikos Vaggalis | |||
| Thursday, 24 November 2022 | |||
|
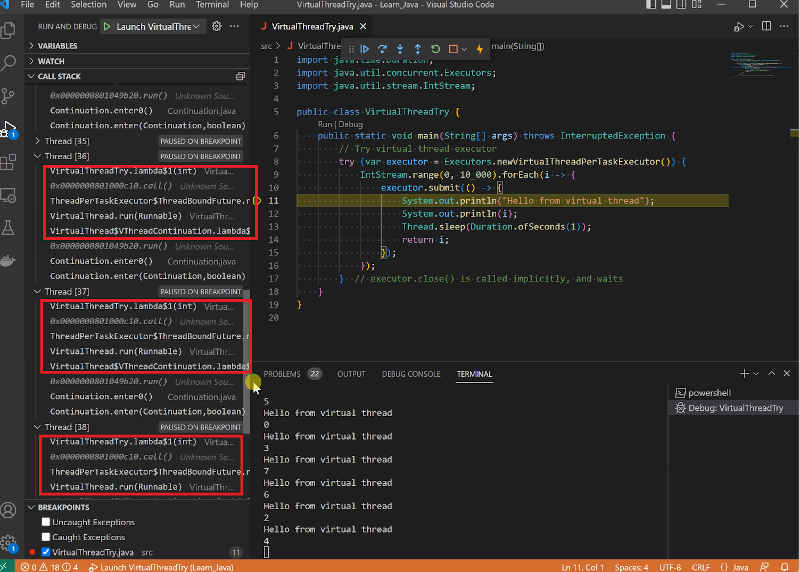
The recently released Java 19 comes with the JEP 425 preview of Virtual Threads as part of Project Loom. VSCode was quick to adapt it. Virtual threads are heralded as the big game changer for Java - even as a replacement for Reactive programming. You get all the goods but not the complexity, with little change to the current API. In September's VSCode release, initial support for virtual threads in the Java debugger was enabled, while in October's edition that support has been improved. Note that you will need to install JDK 19 to use this feature.
Together with enabling Virtual threads debugging support, the general debugging capabilities of VSCode have also been enchanted by adding visual indicators for inline breakpoints Consider a line like this:
Now when you set a breakpoint on this line, Visual Studio Code will automatically identify the lambda expressions in this line, and visualize them with grey dots. If you want to further set inline breakpoints on those lambda expressions, you can directly click on those grey dots, and the grey dots will turn into red dots like normal breakpoints, then the debugger will stop at these breakpoints during the code execution. This is another upgrade of VSCode embracing Java following its newly added Spring enhancements:
It comes as no surprise then that Microsoft is pushing its tools in the Java direction, since yes, Microsoft loves Java too!
More InformationJava on Visual Studio Code Update – October 2022 Related ArticlesMicrosoft Goes All Out On Java Visual Studio Code Adds Command Center And Server Visual Studio Code Adds Language Detection
To be informed about new articles on I Programmer, sign up for our weekly newsletter, subscribe to the RSS feed and follow us on Twitter, Facebook or Linkedin.
Comments
or email your comment to: comments@i-programmer.info |
|||
| Last Updated ( Saturday, 10 December 2022 ) |


