| New WinDbg Available In Preview |
| Written by Kay Ewbank | |||
| Monday, 18 September 2017 | |||
|
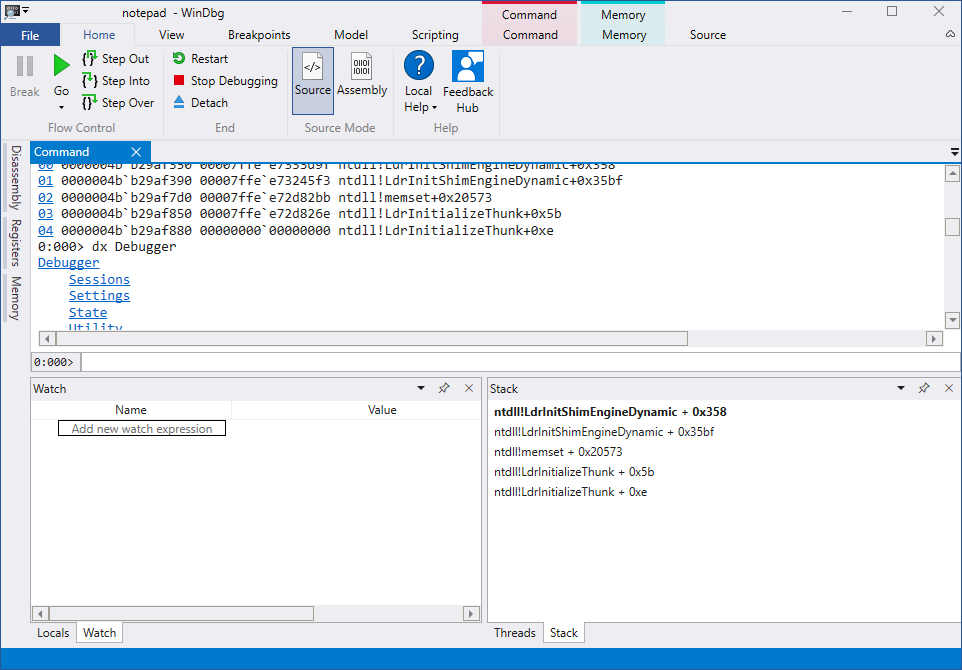
Microsoft has announced a preview version of a new WinDbg. The new version has been updated to have more modern visuals, faster windows, and built-on support for scripting. WinDbg is distributed by Microsoft as part of the Debugging Tools for Windows. It's a debugger for Windows, and can be used to debug device drivers, Windows itself, and user mode applications. The new version retains the extensible debugger data model, and uses the same underlying engine as the current version of WinDbg, so all current commands, extensions, and workflows should continue working. The preview version lacks the command browser, and scratchpad, and the Modules and Events filters windows are also not available in the preview version. Workspaces are implemented differently, meaning existing workspaces don't function 'as expected'. The things that have been added start with options to make WinDbg easier to use. The current version opens with a very minimal screen, and not a lot of guidance as to what different options do. The preview release has a range of items to make things easier for novice users. There's a ribbon to choose actions from, with plans to add more contextual ribbons in future releases.The file menu has been reworked to offer clearer choices, and the attach dialog is cleaner and more organized. Source windows have also been updated to make them look more like those in other editors.
The second set of changes are improvements to the look of the software. The developers say that because the current interface is a bit sparse and gray: "This has led a lot of people to doing registry hacks to get a prettier theme" Which sounds a bit unlikely to us. What's a more reasonable claim is that users have a set of icons pinned to their taskbar for each thing they debug often. The new preview has options to alter the theme and pin icons for you. There's a new dark theme to match other editors, and WinDbg Preview will remember all your recent sessions and some of the settings that you had during that session. Other improvements to the display include making the disassembly window keep its highlighting in the right spot when scrolled, and to give the memory window better highlighting and scrolling. The data model has also been made easier to extend without the need to use JavaScript and the dx command. WinDbg Preview uses the data model to power the locals and watch windows, and extensions to the data model will be reflected in those windows. The developers say you can even put LINQ queries into the watch window. A new type of window called a model window has been added. These show the results of any model query in a normal hierarchy view or a table. Finally, WinDbg now comes with a built-in scripting environment so you can write and execute your JavaScript and NatVis directly from the debugger. The script window has error highlighting, IntelliSense, and easier execution of scripts.
More InformationRelated ArticlesReversible PHP Debugger Released Vorlonjs JavaScript Debugger Released Cortana Skills Kit Now In Developer
To be informed about new articles on I Programmer, sign up for our weekly newsletter, subscribe to the RSS feed and follow us on Twitter, Facebook or Linkedin.

Comments
or email your comment to: comments@i-programmer.info |
|||
| Last Updated ( Monday, 18 September 2017 ) |