| Microsoft Vital Stats |
| Written by Kay Ewbank | |||
| Tuesday, 13 August 2013 | |||
|
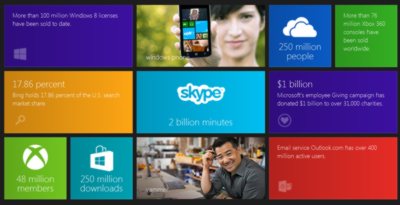
Microsoft has launched, “Microsoft by the Numbers", a website that brings together information from across the range of Microsoft’s businesses and divisions in a single site in an interactive infographic.
Microsoft by the Numbers is described by Microsoft as “a collection of visual statistics about Microsoft products and services.” It’s laid out using Windows 8 “Metro” LiveTile design with individual items on active tiles that you can click on to see more info and links to the tile’s subject.
(click in graphic to visit Microsoft by the Numbers)
Many of the numbers are staggeringly large, others surprisingly small – over 1 billion people use Office (that’s 1 in 7 people on the planet); on the other hand, only 24 million Kinect sensors sold worldwide seems quite low. Let’s face it, all the numbers are massive compared to most other companies, but there’s a certain amount of pleasure in seeing the bits they haven’t dominated (yet). Most of the figures are rounded – 250 million downloads from Windows Store – but instead of telling us that Bing’s share of the US search share market is 18 percent, the statistic quoted is 17.86 percent! Why the spurious accuracy here? The site also makes fascinating reading for the bits where the reaction is “oh, yes, I’d forgotten about that.” Executive social media app Yammer, for instance, has seven million registered users. That means Microsoft has added just two million users since buying Yammer in 2012, and given the size of some of the companies using it (Ford, Shell, Deloitte and Ebay for starters), seven million doesn’t sound that many. Then there are the ‘how did they get to that figure’ ones – is Internet Explorer’s market share still actually 56.5 per cent worldwide? Perhaps the most interesting thing about the page is the figures that don’t make it – sales of Surface devices? Windows RT numbers? For Windows Phone we’re told how many apps are available in the App Store, but not how many are downloaded or how much money is being made. While there wasn’t space to give the numbers for Surface or RT, you can find out how many pizza slices were devoured in Microsoft canteens (554,000 per year), and what the most popular ‘free beverage’ is; about 2,600,000 gallons of free beverages are consumed every year by employees on the Microsoft campus and the most popular soda selection is Coke Zero – 1 million cans are consumed annually. If you want to look through the data in a more leisurely fashion, it’s also available as a PDF download. But like the interactive infographic there’s no clue as to who compiled the data, or why. It does provide its date, however, the information is current as of August 11, 2013. And it answers the questions raised above about where data comes from and why the discrepancy in the accuracy of reporting it. The source of IE usage share comes is Net Market Share and the Bing statistic comes from comScore, if Net Market Share's global figures had been used for Bing its share would have been a less impressive 5.8 percent!
More InformationMicrosoft by the Numbers - site Microsoft by the Numbers PDF download Related ArticlesChrome Overtakes IE In Global Stats Windows 8 Share Overtakes Vista's
To be informed about new articles on I Programmer, install the I Programmer Toolbar, subscribe to the RSS feed, follow us on, Twitter, Facebook, Google+ or Linkedin, or sign up for our weekly newsletter.
Comments
or email your comment to: comments@i-programmer.info
|
|||
| Last Updated ( Tuesday, 13 August 2013 ) |


