| Excel Analytics for Twitter |
| Written by Janet Swift | |||
| Sunday, 12 June 2011 | |||
|
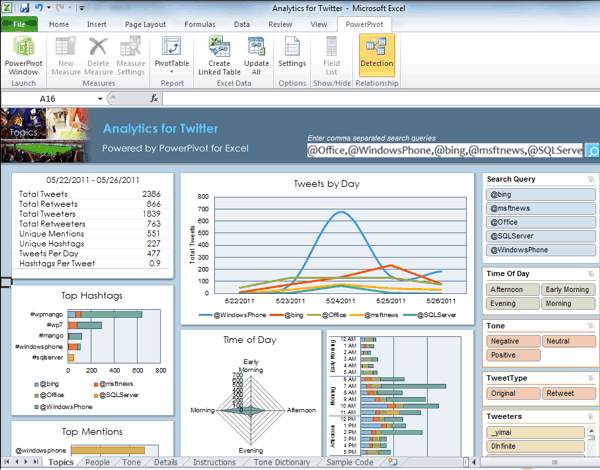
A new add-on for Excel 2010 lets you perform up to five parallel Twitter searches and display the results in a set of dashboards. Analytics for Twitter isn't so much an add-in as a template that comes ready to populate with your own searches. It works with Excel 2010 and the PowerPivot add-on, and in many ways serves as a demonstration of PowerPivot's capabilities.
(click to enlarge) The Instructions are included as a page of the workbook and they are straightforward - replace the contents of the search box with up to five items you want to search for and click the Search icon. Since Analytics for Twitter uses Twitter Search (http://search.twitter.com/) it is fairly slow and you are warned that during periods of high traffic volume it may simply fail to return results - in which case you need to try your search again. Another problem is that Twitter search returns a maximum of 1500 results per day. The template is set up to search the previous 5 day period. One of my test searches came up with 7500 - five times 1500 so exceeding the cap every day - and another that included multiple popular items froze Excel for so long I assumed it had crashed. It hadn't and eventually completed with a message reporting which items had had results clipped at 1500 on one or more days. So to make this a useful tool you need to devise searches that fit within its constraints.
Once the search complete successful you simply click Update all on the PowerPivot tab and Refresh All on the Data tab to see the results on the three supplied dashboards - Topics, People and Tone - whether mentions are positive, neutral or negative as scored by the program; a tone dictionary is supplied. If you want to, you can customize the dashboard views using slicers, DAX formulas or reference tables, but I imagine many people will simply use what has been provided. For more information and to download:
|
|||
| Last Updated ( Sunday, 12 June 2011 ) |


