| Game Of Phones |
| Written by Lucy Black | |||
| Sunday, 24 June 2012 | |||
|
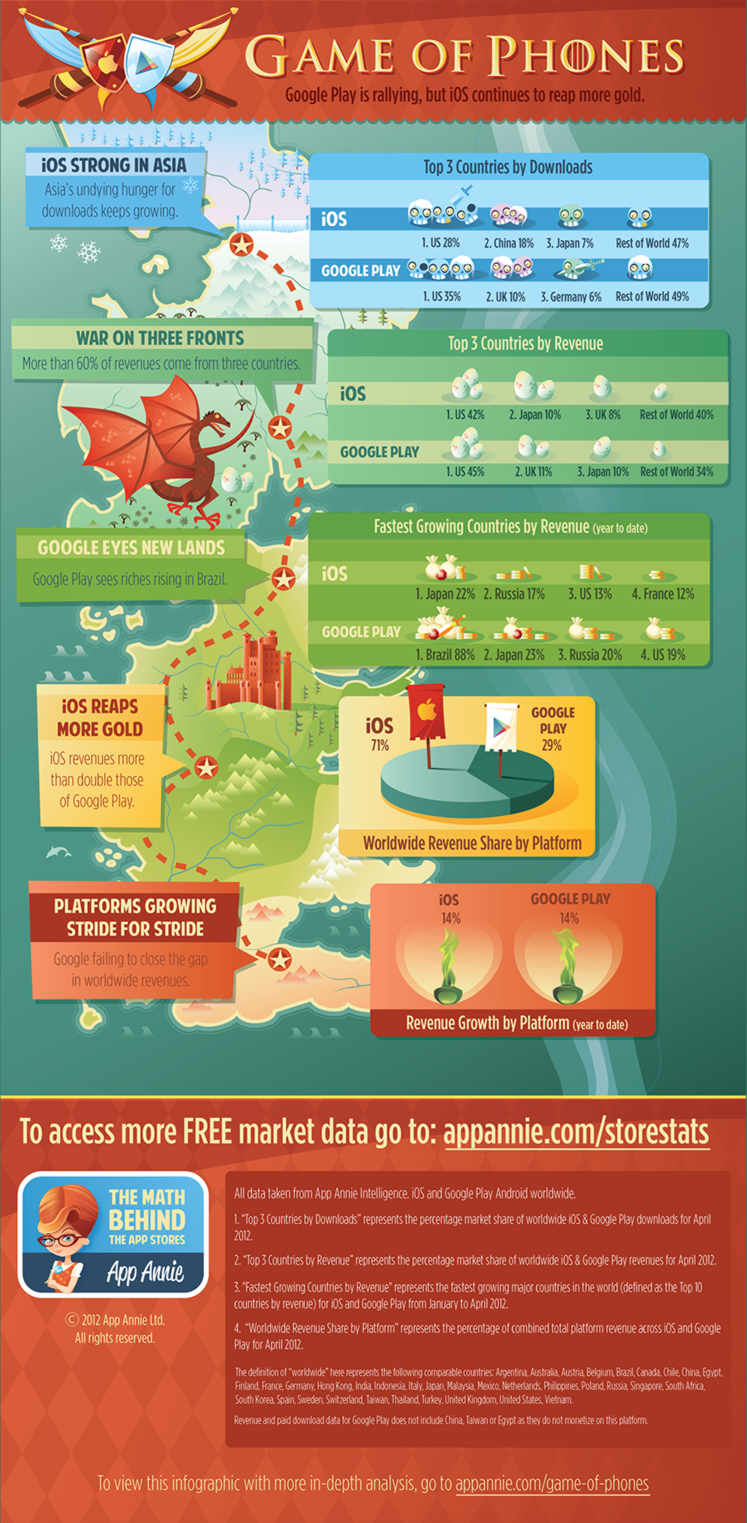
An infographic draws parallels between the battle for supremacy in the app store ecosystem and the popular blockbuster TV epic. Here there are just two players, Android and iOS - after all this time Windows Phone 7 doesn't even signify. The infographic is from App Annie, whose analytics are used by over 100,000 apps. The breakdown is that App Annie gathers data on on 641,304 iOS apps in 123 regional stores and 353,071 Android apps in 35 regional stores. App Annie is used by top companies including EA, Glu, Nokia, Shazam and Microsoft, but registration and use of its analytics is free.
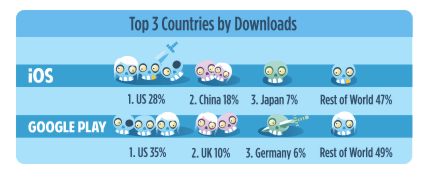
The infographic draws the conclusion that: Despite the emergence of Google Play, iOS revenue stays well ahead For iOS two of the top three countries by downloads are Asian with Europe lagging, while for Android Google Pay has yet to establish itself as the dominant Android app store in Asia.
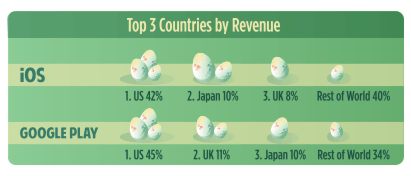
For both app stores the US, Japan and UK generate the most revenue:
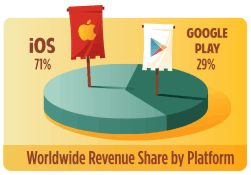
However, Google Play is currently seeing 88% year-to-date growth in revenue. While iOS and Google Play revenues at growing at the same rate (14%) in terms of revenue the worldwide share of revenue is 71% iOS to 29% Google Play - which means that for every dollar spent of Google Play, $2.45 is spent on iOS apps.
More InformationRelated ArticlesApp Store more profitable than Android Market
Comments
or email your comment to: comments@i-programmer.info
To be informed about new articles on I Programmer, install the I Programmer Toolbar, subscribe to the RSS feed, follow us on, Twitter, Facebook, Google+ or Linkedin, or sign up for our weekly newsletter.

|
|||
| Last Updated ( Sunday, 24 June 2012 ) |