| F12 Changes With Windows 8.1 Update |
| Friday, 18 April 2014 | |||
|
The F12 developer tools in Internet Explorer, have been updated by Microsoft to accompany the new releases in IE11. The new version has been improved with the ability to track changes in the CSS tools, along with better debugging. You can now debug in the code you wrote such as CoffeeScript or TypeScript, with sourcemaps support. There’s also the choice to debug only your own code when using libraries from other developers.
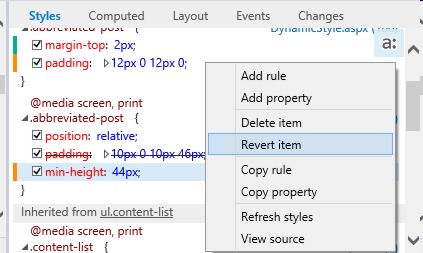
In a blog post about the improvements, the F12 team members say that one advantage tools like F12 offer is they let you edit the look of web sites directly within the browser. The problem this causes is that once you’ve made multiple changes and want to apply those edits to your original source, it can be difficult to keep track of the changes you’ve made to the CSS. The updated version has an option to record and track changes, both visually with ‘change-bars’, as well as through a new ‘Changes’ CSS panel in the in the DOM Explorer. According to the blog post: “Any change you make in the Styles pane in the DOM Explorer to CSS rules and properties will have a visual clue in the left-margin next to the property or rule that you edited. These are the ‘change-bars’, and they show green for new properties, yellow for changed properties and values and red for deleted properties. These change-bars will be retained, even if you begin to look at other DOM nodes.” Recognizing that you may make multiple edits across many nodes, the team has also added a new tab in the CSS panel that lists all the changes in the current F12 session, as a ‘diff’ view so that you can use it as a checklist when you make manual edits to your source code. The “Just My Code” debugging option is designed to stop you accidentally trying to debug third party code when using third party libraries like jQuery or Angular. The blog post says “we often see developers who are debugging their code step into library code, and get buried in the depths of that library, before being able to get back to their code to debug their issue.” Visual Studio has supported a feature called “Just My Code” (JMC) managed languages for a while and with Visual Studio 2012, it is also enabled for JavaScript. This means you will never ‘step into’ a file that is marked as library code. You can mark a library through the file picker in the debugger (see below), even if you have stepped into the file. Once marked, any step operation will take you to your code. One nice improvement to this version is support for Source Maps. You can use this to overcome the problem caused when you have minified JavaScript code that has been compiled to JavaScript from another language. If you write some code in another language then compile it to JavaScript, it’s the JavaScript that executes in the browser and that you debug, not the original code from your editor. This causes headaches when debugging. The developer community came up with Source Maps that keep track of origin, source, and compiled files. F12 has added support for v3 of the Source Map spec. The blog post says “When a compiled JavaScript file defines a valid source map, F12 will default to load the original source file, rather than the running JS file, when ‘source maps’ are turned on (a button on the debugger).” Other improvements include support for ‘three way snapshots’, where you can compare three snapshots created by memory profilers when you’re trying to debug a memory leak – before, after, and back to normal; and the ability to use Visual Studio’s debugging and performance tools for Internet Explorer on Windows Phone 8.1. There’s a full list of changes on the blog post, and the team says they’ll be publishing blog entries over the next few weeks that go into more depth and show you how to use F12. The updated tools can be downloaded from the IE downloads and tools page of the Internet Explorer Dev Center.
More InformationWhat's new in F12 with Windows 8.1 Update Related ArticlesInternet Explorer 11 Preview Updated
To be informed about new articles on I Programmer, install the I Programmer Toolbar, subscribe to the RSS feed, follow us on, Twitter, Facebook, Google+ or Linkedin, or sign up for our weekly newsletter. 
Comments
or email your comment to: comments@i-programmer.info |
|||
| Last Updated ( Monday, 16 June 2014 ) |