| Easy plotting With Chart.js |
| Written by Nikos Vaggalis |
| Tuesday, 10 May 2016 |
|
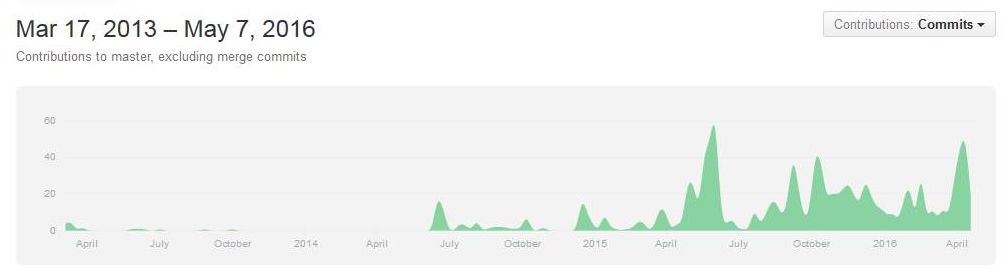
Chart.js 2 has been released with new chart types and improved extensibility. Ease of use is one of this open source library's key features and here we look at how it compares with d3.js at creating a simple bar chart. The JavaScript library Chart.js is an open source project created by Nick Downie in 2013. Now the project has moved from Nick's original GitHub repository to one of its own: github.com/chartjs/Chart.js, where is is currently very active. After a dynamic start and penetration of the JavaScript visualization scene, it looked as though the Chart.js project reached a stalemate, judging from low traffic or better said, lack of commits in its GitHub repository.
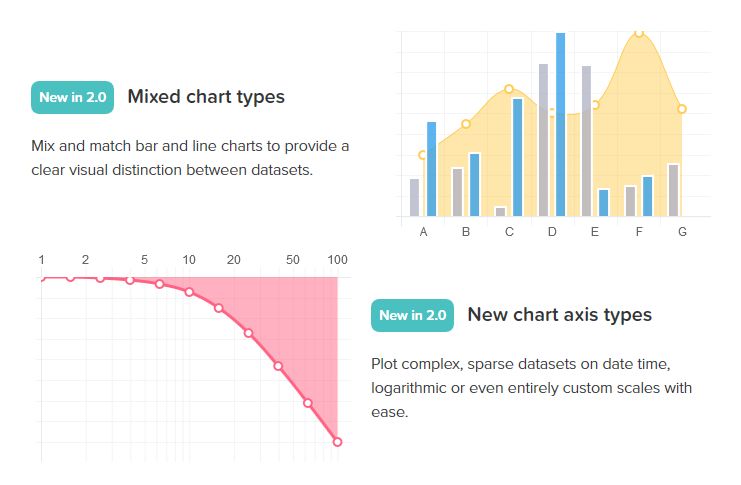
Things started to pick up again around June 2015, with a marked spike in the graph's commit activity, with the greatest activity witnessed in the first quarter of 2016, leading to the release of version 2.0.0-alpha. Looking back,Chart.js version 1.0 was a welcome addition to the club of JavaScript visualization libraries, where it set itself apart by renouncing the SVG -vector drawing- standard, the most popular at the time, for the newer HTML Canvas -bitmap drawing- one. Still, Chart.js did not come with the advanced capabilities of a framework like d3.js. It was limited to only six chart types - line, bar, radar, pie, polar, and doughnut, but its ease of use and flexibility were the two aspects that prevailed and made it stand out from the rest of the libraries. Version 2.0, which represents a major overhaul, offers a totally different proposition. It augments the already established ease of use aspect and focuses on extensibility. It adds more chart types - including stacked area/bar and bubble charts - as well as the ability to mix them. It also adds time and log chart axis types and support for multiple axes. Legends are now supported for all chart types, they can be placed anywhere on the canvas and support toggling data visibility by default. Animation is another new feature with transitions when changing data, updating colours and adding datasets. It is also designed to be responsive and mobile ready with charts, labels and legends all scaling to accommodate any screen size and has touch event support. It also features animation.
Version 2.1.0 was released last week heralding various bug fixes as well as introducing the horizontal bars type and the ability to create plugins that fit into the lifecycle of a chart. Talking about extensibility, the plugins have already started to flock in, with the likes of Chart.Zoom.js, a zoom and pan plugin, released just few days ago, and react-chartjs2, the React component for Chart.js, If that wasn't enough, there's already a new proposed commit for version 2.1.1 that contains one or two minor bug fixes. As already said, ease of use and a low learning curve are the main advantages Chart.js has over alternative libraries like d3.js. This is demonstrated by how trivially simple it is in Chart.js to create the counterpart of d3's simple barchart: Chart.js: and d3.js: var margin = {top: 20, right: 20, bottom: 70, left: 40},
width = 600 - margin.left - margin.right,
height = 300 - margin.top - margin.bottom;
// Parse the date / time
var parseDate = d3.time.format("%Y-%m").parse;
var x = d3.scale.ordinal().rangeRoundBands([0, width], .05);
var y = d3.scale.linear().range([height, 0]);
var xAxis = d3.svg.axis()
.scale(x)
.orient("bottom")
.tickFormat(d3.time.format("%Y-%m"));
var yAxis = d3.svg.axis()
.scale(y)
.orient("left")
.ticks(10);
var svg = d3.select("body").append("svg")
.attr("width", width + margin.left + margin.right)
.attr("height", height + margin.top + margin.bottom)
.append("g")
.attr("transform",
"translate(" + margin.left + "," + margin.top + ")");
d3.csv("bar-data.csv", function(error, data) {
data.forEach(function(d) {
d.date = parseDate(d.date);
d.value = +d.value;
});
x.domain(data.map(function(d) { return d.date; }));
y.domain([0, d3.max(data, function(d) { return d.value; })]);
svg.append("g")
.attr("class", "x axis")
.attr("transform", "translate(0," + height + ")")
.call(xAxis)
.selectAll("text")
.style("text-anchor", "end")
.attr("dx", "-.8em")
.attr("dy", "-.55em")
.attr("transform", "rotate(-90)" );
svg.append("g")
.attr("class", "y axis")
.call(yAxis)
.append("text")
.attr("transform", "rotate(-90)")
.attr("y", 6)
.attr("dy", ".71em")
.style("text-anchor", "end")
.text("Value ($)");
svg.selectAll("bar")
.data(data)
.enter().append("rect")
.style("fill", "steelblue")
.attr("x", function(d) { return x(d.date); })
.attr("width", x.rangeBand())
.attr("y", function(d) { return y(d.value); })
.attr("height", function(d) { return height - y(d.value); });
});
On the other hand d3.js capabilities for advanced data visualization allow it to pull off something like OMG Particles II, so as always use the right tool for the right job. More samples that can get you started with Chart.js can be found at its main GitHub repo, and while you are there, make sure you take a look at a more involved example, that of a Scatter chart
More InformationRelated Articles
To be informed about new articles on I Programmer, sign up for our weekly newsletter,subscribe to the RSS feed and follow us on, Twitter, Facebook, Google+ or Linkedin.

Comments
or email your comment to: comments@i-programmer.info |
| Last Updated ( Tuesday, 10 May 2016 ) |