| More Machine Learning Applied to Google Sheets |
| Written by Janet Swift | |||
| Monday, 12 June 2017 | |||
|
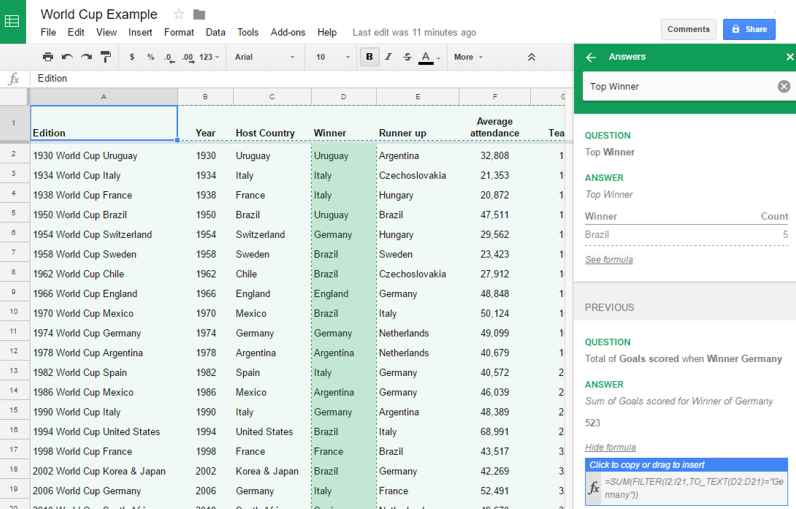
Google has just released an update to Sheets, its spreadsheet application, which extends its Explore facility to creating charts for instantly visualizing data. Google Explore, which adds functionality through machine learning to Google Doc, Slides and Sheets has been available in Sheets for many month, having been available since of September 2016. The idea with Explore in Sheets is that you can use natural language to ask questions about the data in your spreadsheet and Explore will build the formula for you (which you can view if you want to) and present the answer. You could already ask questions like "Top Winner", i.e. the country that was the most frequent winner or discover the "Total of goals scored when Winner Germany". The Explore feature not only provides answers it provides suggestion for questions to ask and prompts with better phrasing of the user's badly formed questions.
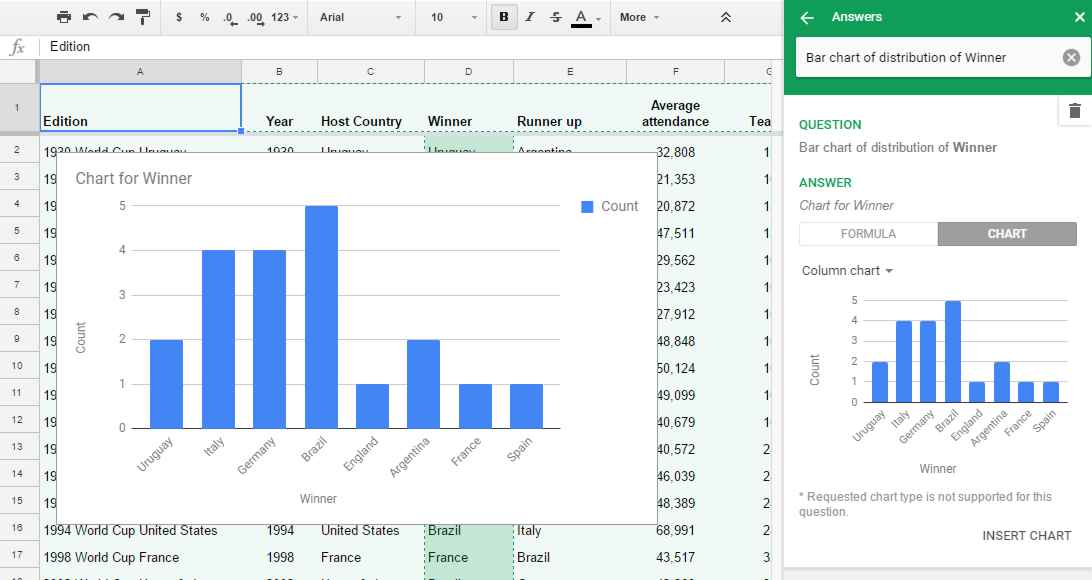
Now you can ask Google to make a chart or graph. So, for example, you can type Bar chart of Distribution of Winner“, see the result and insert it into the spreadsheet.
For users, the Sheets print interface has been improved so they can adjust margins, select scale and alignment options, or repeat frozen rows and columns before sending to the printer. Also in this new version, it will be easier to keep in sync data from Sheets that you use in Docs or Slides. You could already update charts you copy into Docs and Slides with just a click, but now you also can do the same with tables. Spreadsheet developers may feel threatened by the way in which machine learning lets users extract information, and now create charts, using the Explore in Sheets feature. On the other hand it makes the initial construction of the spreadsheet more important than ever so that it permits the user to get answers they want. Another role for Explore visualizations is in looking for erroneous data as it identifies outliers. As AI progresses you can expect this sort of feature to be introduced to more and more "dumb" apps. The nature of the UI is going to have to change to take account of the way inexperienced users are suddenly given the possiblity of creating things that they once would have struggled with.
More InformationVisualize data instantly with machine learning in Google Sheets Related ArticlesCheckCell Detects Bugs In Spreadsheets Is Excel To Blame For Our Economic Pain? Financial Functions With A Spreadsheet (I/O Press) Role Playing Game Programmed as Excel Spreadsheet Lotus 1-2-3 Launched 30 Years Ago Today Companies That Use Spreadsheets Survive Dan Bricklin - inventor of the PC spreadsheet
To be informed about new articles on I Programmer, sign up for our weekly newsletter, subscribe to the RSS feed and follow us on Twitter, Facebook or Linkedin. 
Comments
or email your comment to: comments@i-programmer.info
<ASIN:1871962013> |
|||
| Last Updated ( Monday, 12 June 2017 ) |